Core Evaluation Question IV
What is the impact of the LSC professional development on classroom practice in science and mathematics?
A number of core evaluation data sources contributed information about classroom practices. The teacher questionnaire data provide self-report information from a sample of all LSC-targeted teachers about the frequency with which they use various instructional strategies in their classes. The classroom observations provide an external look at the quality of classroom instruction, including information related to equity, classroom culture, and student engagement that are difficult to measure with questionnaire items.
Teacher Descriptions of Classroom Practice
The design of the core evaluation calls for administration of questionnaires to a random sample of teachers who are targeted for LSC professional development regardless of whether they have actually participated in the LSC at that point. Therefore, in the early years of the LSC initiative, when only a small subset of teachers have participated, the questionnaire data are more useful in describing the general status of science and mathematics instruction in these districts than in evaluating the impact of the LSC.
One finding from these questionnaires is that in LSC districts, as is the case nationally, science is taught less frequently than is mathematics at the elementary level. Whether targeted for professional development in science or mathematics, these elementary teachers were most likely to report teaching reading/language arts each day of the last five (nearly 90 percent in each group), followed by mathematics (80 to 86 percent). Only about 1 in 4 teachers in each group reported teaching science or social studies on a daily basis. (See Figure 38.)
Teachers were also asked to respond to a series of items about instructional practice, indicating how often they used each of a number of instructional strategies in their science and mathematics classes. Factor analysis of these responses was used to create two composites of related items. The "student-centered" composite includes the frequency with which the teacher arranges seating to facilitate student discussion; encourages students to explain concepts to one another; allows students to work at their own pace; and involves students in such activities as formal presentations to the class, student-led discussions, and small group work. The "investigative-culture" composite includes the extent to which the teacher uses open-ended questions; requires students to explain their reasons or supply evidence to support their claims; and involves students in science and mathematics investigations.
Teachers Reporting Instruction in Each Subject on All 5 of the Last 5 days
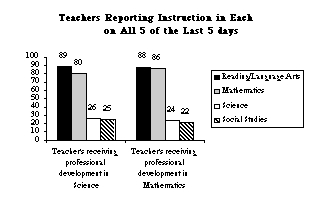
Figure 38
Based on teacher reports, science and mathematics classes were similar in the extent to which they used a student-centered approach, with a mean of approximately 70 percent of total points possible on that composite in each group. As can be seen in Figure 39, there was some variation among projects, with means ranging from 65 to 77 percent in Cohort 1 science, from 62 to 74 percent in Cohort 2 science, and from 67 to 73 percent in Cohort 2 mathematics projects. The composite scores for "investigative culture" were also similar for the three groups, averaging just over 60 percent in each case. (See Figure 40.)
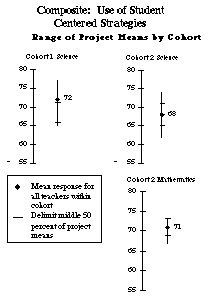
Figure 39
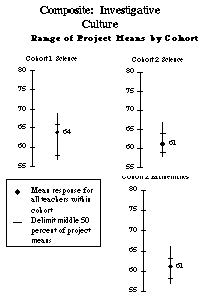
Figure 40
While the overall composite scores were similar, an examination of individual items reveals a number of differences between science and mathematics instruction. Table 12 shows the percent of science and mathematics teachers who reported that each of a number of instructional activities occurred at least once a week. Note that mathematics classes were more likely than science classes to include such activities as teacher presentations of content information, work on solving real-world problems, and homework review at least once a week.
Table 12
Classes Participating in Each Activity at Least Once a Week
|
Percent of Classes |
|
Cohort 1 Science |
Cohort 2 Science |
Cohort 2 Mathematics |
Teacher-led discussions | 81 | 82 | 88 |
| Work in cooperative learning groups | 74 | 70 | 69 |
| Teacher presentation of content information | 73 | 86 | 91 |
| Hands-on activities | 64 | 53 | 74 |
| Share ideas or solve problems in small groups | 54 | 51 | 59 |
| Write reflections in a notebook/journal | 38 | 32 | 25 |
| Review homework | 30 | 37 | 74 |
| Work on solving real-world problems | 30 | 32 | 59 |
| Work on extended investigations | 26 | 25 | 9 |
| Work on portfolios | 16 | 14 | 13 |
| Student presentations | 18 | 21 | 22 |
Table 13 shows the percent of classes that ever participated in particular instructional activities. While mathematics lessons were more likely to include reading from a textbook, science lessons were more likely to include reading other non-textbook materials. Both Cohort 1 and Cohort 2 science classes were more likely than Cohort 2 mathematics classes to include having the students conduct extended investigations, work on portfolios, and write reflections in a notebook or journal some time during the semester.
Table 13
Activities Ever Occurring in Science and Mathematics Classes
|
Percent of Classes |
|
Cohort 1 Science |
Cohort 2 Science |
Cohort 2 Mathematics |
| Read from non-textbook materials in class | 93 | 93 | 60 |
| Conduct extended investigations | 88 | 87 | 73 |
| Participate in field work/field trips | 88 | 83 | 83 |
| Write reflections in a notebook/journal | 86 | 82 | 64 |
| Work on portfolios | 69 | 65 | 51 |
| Read from a textbook in class | 57 | 63 | 69 |
Table 14 shows the percent of classes where teachers report using each of a number of instructional strategies to provide student understanding. Interestingly, science instruction was more likely than mathematics instruction to include the use of open-ended questions, while students in mathematics lessons were more likely to be allowed to work at their own pace and to be asked to explain their reasoning or supply evidence to support their claims.
Table 14
Instructional Strategies Used at Least Once a Week
|
Percent of Classes |
|
Cohort 1 Science |
Cohort 2 Science |
Cohort 2 Mathematics |
| Use open-ended questions | 83 | 81 | 68 |
| Arrange seating to facilitate discussion | 77 | 71 | 71 |
| Allow students to work at their own pace | 72 | 66 | 81 |
| Encourage students to explain concepts to one another | 64 | 62 | 72 |
| Encourage students to consider alternative explanations | 65 | 66 | 72 |
| Require students to explain their reasons/supply evidence to support their claims | 59 | 56 | 85 |
| Read and comment on student journals | 33 | 32 | 31 |
Finally, the teacher questionnaire focused on the use of various strategies to assess student understanding of science and mathematics. As can be seen in Figure 41, the mean percent of total points possible on the use of assessment strategies composite was approximately 50 percent for each group. Project means varied quite a bit, ranging from 41 to 53 percent in Cohort 1 science, from 42 to 58 percent in Cohort 2 science, and from 42 to 58 percent in Cohort 2 mathematics.
The relatively low means in the assessment composite are to be expected. While a very high score on student centered strategies is desirable, a score of 100 percent would mean that a class wrote reflections in a notebook or journal, worked on portfolios, took tests requiring constructed responses or essays, and engaged in performance tasks for assessment purposes on a daily basis. Even if much of that assessment were embedded in instruction, such a class would likely be spending far too much time finding out what students know and far too little time moving their conceptual understanding forward. With that understanding, the assessment composite is useful for looking at trends over time.
Based on teacher reports, the majority of both science and mathematics classes engage in performance tasks for assessment purposes at least once a month. (See Table 15.) Note that mathematics classes are considerably more likely than science classes to take short-answer tests, whether publishers' tests or those developed by the teachers. In contrast, science classes are more likely to have students write their reflections on a fairly frequent basis.
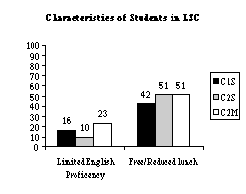
Figure 41
Table 15
Assessment Activities in Science and Mathematics Classes
Using Each Type of Assessment at Least Once a Month
|
Percent of Classes |
|
Cohort 1 Science |
Cohort 2 Science |
Cohort 2 Mathematics |
| Write reflections in a notebook/journal | 66 | 59 | 47 |
| Engage in performance tasks for assessment purposes | 62 | 56 | 63 |
| Work on portfolios | 40 | 41 | 36 |
| Take teacher-developed short-answer tests | 32 | 45 | 58 |
| Take tests requiring constructed responses or essays | 31 | 33 | 38 |
| Take publishers' tests or end-of-chapter tests | 21 | 33 | 65 |
Evaluator Descriptions of Classroom Practice
Additional information on science and mathematics instruction comes from the classroom observations and accompanying interviews, including information about the composition of classes, available resources, and the frequency of various instructional activities.
The lead evaluator of each LSC project was given a list of 10 randomly selected teachers and asked to observe a class in targeted subject during the period March through May 1996. For Cohort 1 projects, the sample to be observed was drawn from a list of teachers who had already participated in LSC professional development.
Student Demographics
- The typical class had 21-25 students in class at the time of the observation; only 7 percent of observed classes had more than 30 students.
Class Size
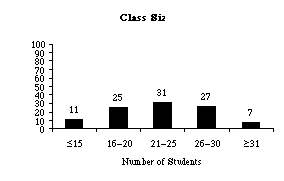
Figure 42
- Minority enrollment in LSC classes is quite high; in half of the observed classes, more than one-half of the students were members of minority groups.
Minority Enrollment in Observed Classes
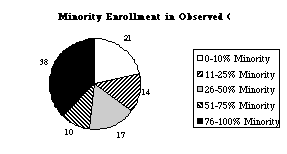
Figure 43
Adequacy of the Physical Environment
Observers found a "normal distribution" in terms of classroom resources, with 83 percent of the classes rated at 2, 3, or 4 on a five-point scale from 1, "sparsely equipped" to 5, "rich in resources."
There appeared to be a difference between Cohort 1 and Cohort 2 classes in terms of adequacy of classroom space, with more than two-thirds of Cohort 2 science and mathematics classes, but fewer than one-third of Cohort 1 science classes judged to have adequate space (4 or 5 on a five-point scale, where 1 is "crowded.")
Purposes and Content of the Lessons
Prior to each observation, the teacher was asked about the purposes of the lesson. As can be seen in Figure 44, there were major differences in reported purposes of science and mathematics lessons. For both Cohort 1 and Cohort 2 science classes, developing conceptual understanding was the most frequently-cited purpose of the lesson, with more than 60 percent of observed teachers (compared to only 36 percent in mathematics) indicating conceptual development was a major purpose. Similarly, about 20 percent of the science lessons had identifying student prior conceptions as a major intended purpose, compared to fewer than 10 percent for mathematics.
Purposes of Science and Mathematics Lessons
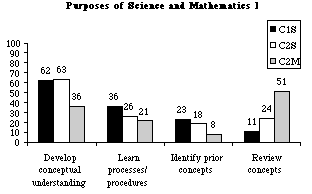
Figure 44
In contrast, mathematics lessons were much more likely to focus on reviewing concepts: review was cited as a major purpose for 51 percent of the observed Cohort 2 mathematics lessons, compared to 11 percent for Cohort 1 science and 23 percent for Cohort 2 science. In fact, 38 percent of the Cohort 2 mathematics lessons had reviewing concepts as the only major purpose listed, compared to 2 percent of the Cohort 1 science lessons and 7 percent of the Cohort 2 science lessons.
In terms of disciplinary content, both Cohort 1 and Cohort 2 science observed lessons were much more likely to focus on life science than on either physical science or earth/space science; only a handful of lessons focused on engineering and design principles.
Focus of Science Lessons
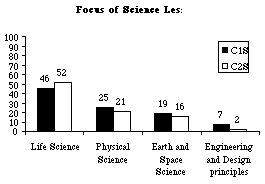
Figure 45
Mathematics lessons most frequently focused on computation, followed by measurement, numeration and number theory, and mathematical patterns and relationships. Very few mathematics lessons included a focus on data analysis and probability or algebraic concepts.
Focus of Cohort 2 Mathematics Lessons
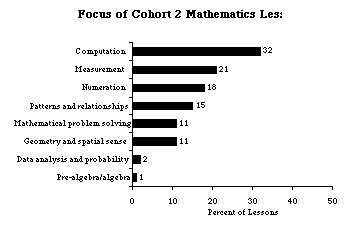
Figure 46
Classroom Activities
As can be seen in Table 16, a typical observed lesson included both a formal presentation by the teacher and some kind of hands-on/investigative activity by the students. Teacher presentations were particularly prevalent in the baseline mathematics classes, with 89 percent of the observed lessons including a formal presentation by the teacher, compared to 78 percent of baseline science classes and 71 percent of Cohort 1 science classes.
Table 16
Instructional Activities in Observed Classes
|
Percent of classes |
|
Cohort 1 Science |
Cohort 2 Science |
Cohort 2 Mathematics |
| Formal presentation by teacher | 71 | 78 | 89 |
| Hands-on/investigative activity | 73 | 60 | 72 |
| Following detailed instructions | 56 | 44 | 57 |
| Record/analyze/represent data | 44 | 33 | 18 |
| Work on models/simulations | 19 | 14 | 6 |
| Design/implement own investigations | 7 | 2 | 3 |
| Play game to develop/renew knowledge/skills | 2 | 11 | 14 |
| Field work/field trip | 1 | 3 | 0 |
| Class discussion | 45 | 40 | 18 |
| Whole class, teacher led | 38 | 37 | 15 |
| Small groups | 12 | 10 | 3 |
| Whole class, student led | 3 | 1 | 0 |
| Reading/writing/reflection | 65 | 59 | 45 |
| Writing reflections in notebooks/journals | 22 | 8 | 1 |
| Reflecting on activities individually or in groups | 17 | 15 | 5 |
| Answering textbook/worksheet problems | 12 | 24 | 38 |
| Reading about science/mathematics | 11 | 17 | 7 |
| Practicing routine computations | 1 | 3 | 12 |
| Identifying patterns | 1 | 2 | 5 |
In both science and mathematics classes, investigative activities tended to be ones in which students followed a detailed set of instructions rather than designing and implementing their own investigations. Both Cohort 1 and Cohort 2 science lessons were more likely than Cohort 2 mathematics lessons to include having students work on models or simulations and be involved in recording or analyzing data.
Similarly, class discussions were more commonly observed in science lessons than in mathematics; in both subjects these were much more likely to be whole class discussion led by the teacher than either small group discussion or student-led whole group discussion.
Relatively few observed classes in either Cohort involved students in reading about science or mathematics. In contrast, answering textbook/worksheet questions was fairly common, especially in the baseline classes, with 12 percent of Cohort 1 science classes, 24 percent of Cohort 2 science classes, and 38 percent of Cohort 2 mathematics classes involved in that activity. Finally, science lessons of Cohort 1 treated teachers were more likely to have students writing their reflections in a notebook or journal (22 percent compared to 8 percent of Cohort 2 science lessons and 1 percent of Cohort 2 mathematics lessons.)
An Evaluative Look at Classrooms
Evaluators were asked to rate each lesson on specific indicators within five components of classroom practice: the quality of the lesson design; how well it was implemented; the quality of the science/mathematics content; the classroom culture; and the extent to which the lesson will enhance student capacity to engage in science and mathematics. Highlights of these ratings are described below.
Design
Table 17 shows the percent of observed lessons in Cohort 1 science, Cohort 2 science, and Cohort 2 mathematics classes that received high ratings (4 or 5 on a five-point scale) in each of a number of indicators within the design category. Note that the Cohort 1 science lessons, taught by teachers who had participated in LSC professional development, were more likely than the baseline Cohort 2 science lessons to receive high ratings on several design indicators: appropriateness of strategies for the purposes of the lesson; encouraging a collaborative approach to learning, and incorporating tasks, roles, and interactions, consistent with inquiry.
Baseline mathematics lessons had design ratings similar to baseline science lessons in some areas (encouraging collaboration, and incorporating inquiry strategies). They were rated as highly as Cohort 1 science lessons in appropriateness of strategies for accomplishing the purposes of the lesson, and higher than either of the science cohorts in the extent to which the instructional strategies appeared to meet the varied needs and learning styles of students.
Table 17
Lessons Rated 4 or 5 on Design Indicators
|
Percent of Lessons |
|
Cohort 1 Science |
Cohort 2 Science |
Cohort 2 Mathematics |
| Strategies contributed to accomplishing purposes | 60 | 46 | 56 |
| Design encouraged collaborative approach | 48 | 36 | 32 |
| Design incorporated tasks, roles consistent with inquiry | 46 | 21 | 16 |
| Strategies appeared to meet varied student needs/learning styles | 41 | 46 | 57 |
Figure 47 shows evaluators' holistic ratings of the design of the observed science and mathematics lessons. Note that Cohort 1 science lessons were considerably more likely to receive high ratings in the overall design than either baseline science or mathematics lessons.
Lessons with High Ratings for Design
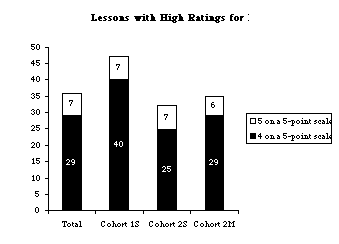
Figure 47
Implementation
The percent of lessons receiving high ratings on each of a number of indicators of the quality of implementation is shown in Table 18. Note that the majority of teachers in each group were seen as confident in their ability to teach their subject. In contrast, relatively few teachers in any group received high marks for the extent to which their questioning strategies encouraged students' conceptual understanding.
Classes taught by LSC-participating teachers were considerably more likely than others to receive high ratings for incorporating inquiry-based strategies, into their instruction, while the Cohort 2 mathematics lessons received higher ratings than either science group on the appropriateness of the lesson pace.
Table 18
Lessons Rated 4 or 5 on Implementation Indicators
|
Percent of Lessons |
|
Cohort 1 Science |
Cohort 2 Science |
Cohort 2 Mathematics |
| Teacher appeared confident | 67 | 64 | 72 |
| Pace of lesson was appropriate | 46 | 52 | 59 |
| Teacher attended effectively to student prior conceptions | 40 | 45 | 34 |
| Strategies consistent with inquiry | 40 | 27 | 24 |
| Questioning strategies enhanced conceptual understanding | 32 | 20 | 30 |
Overall, one-third of the observed lessons received high marks (4 or 5) on implementation, including 28 percent of baseline science classes, 38 percent of baseline mathematics classes, and 41 percent of classes taught by teachers who had participated in LSC professional development. (See Figure 48.)
Lessons with High Ratings for Implementation
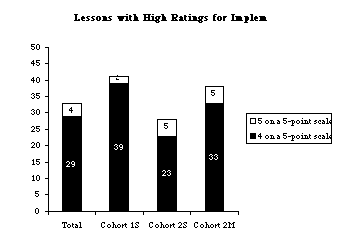
Figure 48
Content
As can be seen in Table 19, Cohort 1 science lessons were more likely than baseline science lessons to receive high ratings in each of the indicators of content quality. Differences were most pronounced for content accuracy and the extent to which concepts and processes were balanced appropriately.
Baseline mathematics lessons had content ratings similar to baseline science lessons in some content indicators, including appropriateness, balance of concepts and processes, and the extent to which the subject was portrayed as inquiry. Ratings on relevance and accuracy of content and the quality of the lesson closure were more similar to those of Cohort 1 science lessons.
Table 19
Lessons Rated 4 or 5 on Content Indicators
|
Percent of Lessons |
|
Cohort 1 Science |
Cohort 2 Science |
Cohort 2 Mathematics |
| Teacher-presented information was accurate | 86 | 70 | 84 |
| Content appropriate for purposes of lesson | 66 | 56 | 69 |
| Content relevant to student needs/interests | 66 | 56 | 68 |
| Connections made to real-world applications | 52 | 40 | 48 |
| Concepts and processes appropriately balanced | 45 | 31 | 32 |
| Degree of closure appropriate | 38 | 30 | 29 |
| Science/mathematics portrayed as inquiry | 37 | 30 | 21 |
Overall, 35 percent of baseline science classes, 38 percent of baseline mathematics classes, and 46 percent of Cohort 1 science classes received ratings of 4 or 5 for content. (See Figure 49.)
Lessons with High Ratings for Content
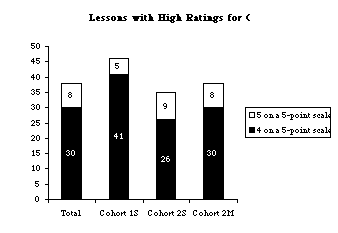
Figure 49
Classroom Culture
Evaluator ratings of a number of indicators related to classroom culture are shown in Table 20. Roughly two-thirds of the observed teachers in each Cohort received high marks for encouraging the active participation of all students. Other aspects of the classroom culture were not rated as highly, especially for baseline science and mathematics classes. For example, while evaluators assigned ratings of 4 or 5 to 55 percent of Cohort 1 science lessons for reflecting "collaborative working relationships among students," only 38 percent of Cohort 2 science lessons and 28 percent of Cohort 2 mathematics lessons were rated that highly.
Table 20
Lessons Rated 4 or 5 on Classroom Culture Indicators
|
Percent of Lessons |
|
Cohort 1 Science |
Cohort 2 Science |
Cohort 2 Mathematics |
| Encourage active participation of all | 70 | 65 | 68 |
| Room arrangement facilitated interaction | 67 | 50 | 54 |
| Collaborative working relationship between students and teachers | 63 | 44 | 52 |
| High expectations for all students | 60 | 56 | 55 |
| Collaborative working relationship among students | 55 | 38 | 28 |
| Student ideas/conjectures encouraged | 49 | 34 | 40 |
| Students intellectually engaged with important ideas | 48 | 37 | 33 |
| Intellectual rigor and challenging of ideas encouraged | 35 | 30 | 24 |
Overall, 32 percent of the observed lessons were rated at a level 4 or 5 for classroom culture, including 30 percent of baseline science lessons, 26 percent of baseline mathematics lessons, and 46 percent of Cohort 1 science lessons. (See Figure 50.)
Lessons with High Ratings for Classroom Culture
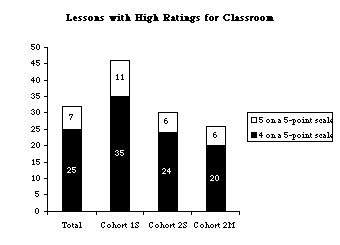
Figure 50
Enhancing the Ability of Students to Successfully Engage in Science and Mathematics
The final set of ratings on the classroom observation protocol asked evaluators to consider all of their previous ratings in assessing the likelihood that the lesson would enhance the ability of students. A number of key areas were specified, including understanding key science and mathematics concepts, understanding the nature of inquiry, being able to generalize their learning to real-life situations, and becoming self-directed learners. While evaluators often rated individual components of the lessons highly, their summary judgments of the likely impact of the lessons were generally less positive. For example, only 35 percent of the Cohort 1 science lessons, and even fewer Cohort 2 science and mathematics lessons, received high marks for the likelihood of enhancing students' understanding of the nature of inquiry. (See Table 21.)
Table 21
Lessons Rated 4 or 5 on Indicators of Enhancing Student Ability
|
Percent of Lessons |
|
Cohort 1 Science |
Cohort 2 Science |
Cohort 2 Mathematics |
| Increase ability to become self-directed learners | 41 | 30 | 39 |
| Enhance conceptual understanding | 39 | 29 | 38 |
| Increase ability to apply knowledge to real-life situations | 35 | 31 | 24 |
| Enhance understanding of nature of inquiry | 35 | 22 | 27 |
Overall, 27 percent of the observed lessons were rated a 4 or 5 in this area, including 23 percent of baseline science classes, 30 percent of baseline mathematics classes, and 36 percent of science classes taught by teachers who had participated in LSC professional development. (See Figure 51.)
Lessons with High Ratings for Likely to Enhance Student Ability
Figure 51
Overall Ratings of Observed Classes
As the final step in completing the observation protocol, evaluators were asked to indicate the "level" that best described each lesson they observed. Table 22 shows the percent of lessons in each Cohort considered effective instruction, beginning stages of effective instruction, and ineffective instruction. The shaded boxes contain examples of lessons that were assigned to each of these categories. Note that only 32 percent of Cohort 1 science lessons were rated as effective instruction, quite close to the 27 percent of Cohort 2 science lessons and 29 percent of Cohort 2 mathematics lessons that were rated that highly. The major difference between Cohort 1 and Cohort 2 science lessons is at the lower end of the scale, with lessons of treated teachers more likely to be considered in the beginning stages of effective instruction and less likely to be considered ineffective in structure.
Table 22
Overall Ratings of Observed Classes
|
Percent of Lessons |
|
Cohort 1 Science |
Cohort 2 Science |
Cohort 2 Mathematics |
| Effective Instruction | 32 | 27 | 29 |
| Beginning stages of effective instruction | 45 | 36 | 54 |
| Ineffective Instruction | 29 | 37 | 17 |
Lesson #1:
Ineffective Science Instruction-Passive "Learning"
The teacher stands at the front of a sparsely-equipped urban classroom and leads his third grade class, composed of mostly minority students, through a lesson about the life cycle of a butterfly. Using commercially-prepared packets, the teacher proceeds page-by-page, asking students to locate and hold up the correct page and assigning, round-robin fashion, the task of reading aloud. After reading, the teacher asks questions that require one-word answers, which he writes on the board, and students copy into their notebooks. The students then fill out worksheets. The information presented is limited to the names of the life stages; there is no reference to the processes of change and the lesson seems more like a reading/vocabulary lesson than science. Although desks are arranged in groups, there is no collaboration among students. The lesson appears too simple for the children, although they are eager to participate, to give the "correct" answers, and to fill in the blanks on their worksheets.
|
Lesson #2:
Ineffective Mathematics Instruction-Activity for Activity's Sake
As students in this seventh grade mathematics class arrive and take their seats, they open their notebooks and begin correcting their homework based on answers projected on the overhead screen. The teacher then turns off the overhead, and reviews previous work the class has done with measurement, especially alternative methods of measurement (such as arm span, finger length, stride length). She then instructs the class to open their math text to the page containing today's activity: measuring places on campus using alternative methods of measurement. Students are told to form groups of 2-4 and go outside to take measurements. There is little time for students to ask questions; some are clearly bewildered by the assignment, but the teacher is unaware of their reaction. Later, as students return from outside, they seem more focused on socializing than on math. The only closure at the end of the class is to tell students to present their measurements the next day.
|
Lesson #3:
Beginning Stages of Effective Mathematics Instruction
A kindergarten class engages in several activities to reinforce counting, adding, and subtracting skills. The teacher introduces the lesson by holding up Unifix cubes (two red, one white) and asking students the total number of cubes. When students offer answers, she asks them how they got their answers and reinforces their responses by reminding them there are different ways to arrive at answers. The lesson continues with a game using Unifix cubes and laminated game boards. The whole class sits in a circle, and students take turns rolling a die and adding or subtracting cubes on the game board with the teacher's help ("Lisa rolled a 5-how many would it take to get to 5 on your board if you already have 2 cubes on it?"). Students later pair off to play another game with the cubes. Students are engaged, and it is evident that the majority see the various ways to determine the total number of cubes (counting, adding, subtracting). However, little debriefing or discussion takes place after the activities.
|
Lesson #4:
Effective Science Instruction
As part of a plant unit that includes several related activities, including a visit to a neighborhood nursery, fourth grade students meet to discuss the progress of their extended experiments. Working in groups of four, they have previously planted six seed pots: three as a control group, and three with one variable changed (e.g., extra fertilizer, blue dye in water, watered with soda). The groups share the results of their experiments so far, demonstrating facility in working collaboratively, in reporting back to the class, and in using appropriately vocabulary words such as "control" and "variable." The teacher is confident and well-versed in science, but allows the students to lead discussions; all students, particularly girls, are noticeably at ease in their presentations, even when expressing some uncertainty or tentativeness about their ideas. To close the lesson, the teacher outlines the parameters for another experiment. Each group of students works together to choose their own variables to test, and they write a plan based on their discussion.
|
Lesson #5:
Effective Mathematics Instruction
To practice subtraction skills, a first grade teacher reintroduces a previously-played game involving a set number of Unifix cubes in a bowl or tub. Reviewing earlier lessons, the teacher asks for examples and students demonstrate various subtraction strategies including counting cubes, counting with fingers and elbows, and drawing pictures. Then students pair off to play several rounds of "The Tub Game": taking turns, one student hides some of the 12 Unifix cubes, and the partner determines the number of hidden cubes based on the number remaining in the tub. The student then writes a "number sentence" (equation), and checks with the partner to confirm that the equation matches the actual number of cubes taken from the tub. Students are engaged and collaborative, if somewhat competitive, and appear to be making the connection between the symbolic and the concrete. The lesson ends with a group discussion of difficulties, helpful strategies, and a few additional student demonstrations. The teacher's focus is on each student using the strategies that help her/him the most.
|
Summary
Teacher questionnaires and classroom observations provide a consistent picture of science and mathematics instruction in LSC districts. Teacher presentations are common, especially in mathematics classes, where 91 percent of teachers report presenting content information at least once a week and 89 percent of observed lessons included a formal presentation by the teacher. Hands-on and other investigative activities are also fairly common, with the majority of teachers in each group reporting that their classes do hands-on activities at least weekly, and most observed lessons including some kind of hands-on/investigative activity.
As is the case nationally, most teachers in LSC districts teach mathematics on a daily basis, but only about 1 in 4 has a science lesson each day. Instruction in these subjects has different emphases, as well. Mathematics lessons are more likely than science lessons to focus on reviewing concepts, using what has been learned to solve "real-world problems," having students explain concepts to one another and supply evidence to support their claims, and homework review. Science lessons are more likely than mathematics lessons to emphasize identifying prior student conceptions and developing conceptual understanding and more likely to use open-ended questions and have students write their reflections in a notebook or journal.
Cohort 1 science lessons, taught by teachers who had participated in LSC professional development, generally were more likely than baseline science or mathematics lessons to receive high ratings on lesson design, content, and implementation, as well as the quality of the classroom culture. Cohort 1 lessons were rated particularly high on the extent to which:
- The discipline was portrayed as a process of inquiry, and the lesson incorporated tasks, roles, and interactions consistent with inquiry;
- Concepts and processes were balanced appropriately;
- The room arrangement encouraged student-centered interaction; and
- Students were encouraged to generate ideas, conjectures, and propositions;
- The degree of closure or resolution of conceptual understanding was appropriate for the purposes of the lesson.
However, when considering the lesson as a whole, evaluators were equally likely to give high ratings to baseline science and mathematics lessons as to science lessons taught by teachers who had participated in LSC professional development.
- These data have the advantage of reflecting the judgment of objective observers, rather than teachers' own interpretations of classroom practices. However the reader is reminded that the 1996 observation data reported here are limited to 273 classrooms (73 Cohort 1 science, 145 Cohort 2 science, and 52 Cohort 2 mathematics). As is the case with data provided in the teacher questionnaires, classroom observation data were weighted to represent the population of eligible teachers in each project (all targeted teachers for baseline data in Cohort 2 projects, and all treated teachers in Cohort 1 projects).
- "Ineffective instruction" includes lessons the observers categorized as level 1a, passive learning; level 1b, activity-for-activity's sake; and level 2, elements of effective instruction. Lessons rated a low or solid 3 are considered "beginning stages of effective instruction," while those rated a high 3, 4, or 5 are considered "effective instruction."
|

