
 |
|||
Conference MaterialAn emerging profile of the mathematical achievement of students in the Core-Plus mathematics project
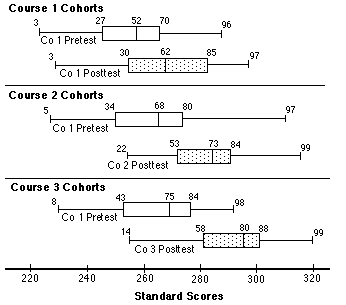 Figure 1. Box plots of school means of ATDQT Course 1 pretests and posttests for CPMP students in three cohort groups. Results for Various School and Student Groups By School Type The field test schools included eight rural schools, eight urban schools, and 15 suburban schools. ATDQT results are summarized by these school classifications in Table 4. With the exception of urban schools in Course 1, all adjusted effect sizes are at least .30. There is no significant difference (p =.05) in posttest means across school types for Course 2 and Course 3 cohorts when differences in pretest means are taken into account by analysis of covariance. Table 4. Mean of School Means, National School Mean Percentile, and Adjusted Effect Size for Pretests and Posttests of the Courses 1, 2, and 3 Cohort Groups in Rural, Urban, and Suburban Schools
Interestingly, the effect sizes in urban schools in Courses 2 and 3 were excellent (.62 and .59, respectively) even though the students in both those cohort groups were a subset of those in the Course 1 cohort group (-.15). According to teachers in urban schools, the students who did not continue beyond Course 1 were those with the most problems, whether academic or otherwise. The more motivated students who remained were then able to blossom in the improved Course 2 and Course 3 classroom environments. Adjusted effect sizes in suburban schools, while at or above .30, were somewhat smaller than most of those in rural and in urban schools. This may be at least partially due to a statistical effect, regression to the mean, rather than to a real difference in CPMP's effect. Since pretest means in the suburban schools were much higher than those in schools of the other types, there is a lower probability of substantially still higher scores on the posttest in suburban schools . In other words, for the suburban schools there is "less room for growth" on the ATDQT than for the rural and urban schools. By Make-up of CPMP Classes Several different methods of assigning students to CPMP classes at the beginning of grade nine were used in the field test schools. Since the CPMP curriculum is intended for all (or certainly a very wide range of) students, this variable is a potentially important one. There were five main assignment methods.
Table 5.
There are large fluctuations in results from year to year in some categories, especially work-prep. This is at least partially due to the small numbers of schools in the category. The dramatic turnaround after Course 1 in the work prep schools is also an indication that some of the students with the worst academic and social problems did not continue into Course 2, as discussed above with respect to urban schools. The impressive magnitude of the adjusted effect sizes for work prep schools in Course 2 and 3 is probably also partially due to regression to the mean, since the pretest means were at the 12th and 18th percentile, respectively. There was a great deal of "room to grow" on the ATDQT so improvement was more likely than for groups of students whose pretest scores were already well up the scale. With the exception of the work prep schools in Course 1, CPMP students' adjusted effect sizes across the class assignment methods and course cohorts were positive and often in the .30 to .55 range. By Gender In the CPMP field test sample, there are many interesting gender differences, mostly consistent with the compatibility of CPMP with female preferences (Schoen & Pritchett, 1998). At present, the ATDQT results have been analyzed by gender with little of significance to report. Our intent is to complete a careful analysis and report of all data by gender, but that work is not complete at this time. The following is a sample of ATDQT gender findings. The Course 3 cohort group (N = 1457) completed not only the Pretest and the Course 3 Posttest, but also the Posttests for Course 1 and 2. The pattern of growth across all these ATDQT measures by gender, with school by gender means as the statistical unit, is given in Table 6. Mean scores for males are significantly higher at each test time, but pretest to posttest growth as reflected by the adjusted effect size is greater for each test. However, female and male posttest means adjusted for pretest differences (using analysis of covariance) are not significantly different at the .05 level for any of the three courses.
Table 6.
By First Language and Minority Group Status In the Course 3 cohort group, there were 77 students (5.3%) who indicated that English was not the first language they had learned at home before coming to school. The numbers in each school in this category and in the minority group categories later in this section were too small to allow the use of school means, so student standard scores are the statistical unit for this analysis. Adjusted effect sizes in this section can be expected to be lower than those in earlier sections in which school means were the statistical unit. The reason is that the denominator of the adjusted effect size, the standard deviation on the pretest, is larger because it is a standard deviation of student scores not of school means. In general, adjusted effect sizes in this section may be compared to one another but should not be compared to those in other parts of the paper. With that caveat, Table 7 shows the growth of the two first language groups. The adjusted effect sizes for the English as second language (ESL) students are all higher than those for the other students suggesting that the CPMP curriculum may be particularly effective with such students. Of course, these "ESL" students were not necessarily students with English language difficulty at the time that they were in CPMP classes. They simply indicated that English was not the first language they had learned at home before coming to school.
Table 7.
The numbers and percents of Course 3 cohort students who indicated that they were best described as members of the following minority groups are: African American (67; 4.6%), Hispanic (57; 3.9%), Asian American (45; 3.1%), Native American or Native Alaskan (18; 1.2%). ATDQT minority group results are presented in Table 8. With two exceptions, all effect sizes for all minority groups were at least as high as those of the group of White (non-Hispanic) students. For both exceptions (African Americans in Course 1 and Native Americans or Native Alaskans in Course 3), the adjusted effect size was very small, but positive, meaning that growth was slightly greater than that of the national norm group at the same pretest level. Both these minority groups had strong effect sizes in the other two years, so perhaps these near zero effect sizes were anomalies. The group which appears to be the most positively impacted by CPMP were Hispanics. This finding is consistent with the literature on the social preferences and learning styles prevalent among Hispanic groups.
Table 8.
By High Mathematical Aptitude and Background When the CPMP evaluation study was in its second year, a Mathematics Science Center (MSC) in a medium-sized midwestern city requested permission to use the Core-Plus Mathematics curriculum with all their students. This school is a magnet school that is for students in grades 9-12 from around the district with particularly strong interest, aptitude and background in mathematics and science. It was too late to include the MSC in the CPMP field test, but we decided to test the MSC students and to follow the progress of the program's use at the MSC. Thus far, we have administered the ATDQT as a pretest at the beginning of Course 1 and in alternative form in May as a posttest of Course 1. The following box plot shows the pretest and posttest distributions of all 90 MSC students who completed both tests. A perfect score of 40 items correct corresponds to a standard score of 353. National percentiles (for the appropriate testing time) that correspond to points identified in the box plots are shown on the graph.
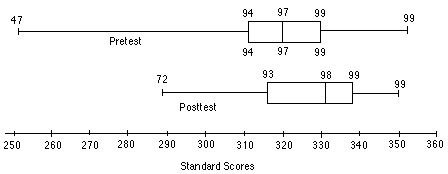 Figure 2. Box plot of pretest and posttest distribution for the Mathematics and Science Center students In spite of a regression to the mean effect due to very high pretest scores, the posttest mean was approximately 11 standard score points higher than the pretest mean. This is a growth about double that of the ninth-grade norm group at the same point in the distribution. Viewed another way, the growth of the MSC Core-Plus students' mean from pretest to posttest was about 0.25 standard deviations greater than the growth of the nationally representative ninth-grade norm group at the same point in the distribution. Results on Various Achievement Outcomes CPMP Posttests In order to obtain a measure of students' attainment of some of CPMP's specific curriculum objectives, the CPMP evaluation team developed posttests for the end of each course. These tests, described earlier in this paper, include subtests of various content and process outcomes, and performance of CPMP students across these subtests is an important part of the CPMP achievement profile. Course 1 Posttest Part 1 was comprised of three subtests, called Algebra Concepts I, Algebra Concepts II, and Procedural Algebra. The first two subtests required students to show that they understood algebraic concepts by applying them in realistic settings and interpreting their meaning within those settings. In particular, they were required to translate between contextual problem situations and algebraic (linear) representations of the situations including graphs, equations or inequalities, and tables. These subtests also required students to re-write algebraic expressions in equivalent forms (that is, simplify expressions and solve equations) that provided insights into a problem context, and to explain how solutions or equivalent forms represented new information in the problem context. The third subtest required students to solve linear equations in one variable and simplify linear expressions with no context. A five-point general scoring rubric was used as the basis for developing highly specific descriptions of what constituted a score of 0 through 4 on each test item. Scores ranged from 4 for a "complete, correct response with clear unambiguous work or explanation" to 0 for "no response or an irrelevant response." Graduate and advanced undergraduate Secondary Mathematics Education students were trained to use the rubrics to score the posttests. Training and practice on the scoring of each task continued until the inter-scorer agreement was 90% or higher. Figure 3 shows the mean Posttest results for a random sample of 1,102 CPMP students and for all 743 students in the traditional comparison classes who completed this test. The Cronbach Alpha reliability coefficient for the total test was 0.89. Since CPMP and comparison students had almost identical median ATDQT pretest scores (The comparison group had a slightly higher mean on the ATDQT pretest.), a comparison of the posttest means is appropriate. CPMP students' CPMP Posttest Part 1 mean scores in these schools were higher than comparison students on the Algebra Concepts I and Algebra Concepts II subtests. The effect sizes (difference in means divided by the standard deviation of the comparison group) were 0.89 and 0.59, respectively. On the Procedural Algebra subtest, the comparison group's mean was higher (effect size = 0.22).
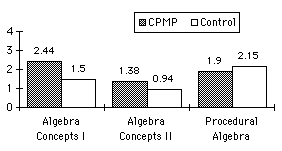 Figure 3. Course 1 CPMP Posttest Part 1 subtest means of CPMP and comparison groups The task in Figure 4, from the Algebra Concepts I subtest, provides as an example of the algebraic understanding and reasoning required on the CPMP Posttests. Means and standard deviations of the CPMP and comparison groups on each part of this task are also given.
Figure 4. Task from the Course 1 Posttest, Algebra Concepts I subtest The meaning of the results for parts (a) and (b) is discussed below. Parts (c) and (d) can be interpreted in a similar way. In part (a), the intent was for students to indicate that 18 is the number of gallons of gasoline the boat had on board at the start and -2 indicates that 2 gallons of gasoline are used by the boat for each mile it travels. Such a response was given a score of 4. The mean of the CPMP students on part (a) was 2.5, midway between 2 and 3. A score of 3 means either (1) that both parts of the question were answered but with some vagueness such as "18 is the starting point" or "-2 is the slope" or (2) one question was answered at a 4-level and the other was vague or incorrect. The comparison students, mainly from Algebra 1 classes, had a mean of slightly less than 2 on part (a). A score of 2 was assigned if (1) one part of the response was vague but relevant, that is, at the 3-level, but the other part was incorrect or (2) one part of the question was answered at the 4-level but the other part was missing. In part (b), students were to graph the given linear equation on a grid that was provided. An answer at the 4-level would be an accurate graph with an explanation that indicated that 18 was the y-intercept of the graph and -2 was its slope. The CPMP students' mean was 2.0, a score that was assigned if (1) the graph was accurate but no explanation or a totally irrelevant explanation was given or (2) the graph was linear but had mistakes such as a slightly incorrect slope or positioning and a relevant but vague explanation was given. On average, the comparison students scored at about the 1-level on this part. This means that the graph was incorrect in a serious way such as composed of segments, bars, or a saw tooth or curved shape, and no relevant explanation was given. In short, the mean of the comparison students was at a level that suggests virtually no understanding of the content that was measured in part (b). The Course 2 Posttest Part 1 also contained three subtests, called Coordinate Geometry, Algebra Concepts, and Procedural Algebra. The Coordinate Geometry subtest presented a contextual situation overlaid on a coordinate system, and students were required to apply concepts and methods of coordinate geometry and explain the meaning of the results in the context. Concepts and methods included finding the equation of a line given two points on it, the point of intersection of a vertical line and a second line, the midpoint of a segment, the distance between two points, an estimate of the area of an irregular closed region, and the plot of the reflection image of a given point across a given line. A related contextual problem situation required the use of right triangle trigonometry to solve a triangle for an unknown side. As in Course 1, the Algebra Concepts subtest required students to show that they understood algebraic concepts by applying them in a realistic setting and interpreting their meaning within that setting. In particular, they were required to translate between problem situations and algebraic (in this case, quadratic) representations of the situation including graphs, equations or inequalities, and tables. This subtest also required students to transform algebraic expressions into equivalent forms (that is, solve equations and simplify expressions) that provided insights into a problem context, and to explain how solutions or equivalent forms represented new information in the problem context. The Procedural Algebra subtest required students to solve linear equations in one variable and simplify linear expressions involving parentheses with no context. Students also were required to apply the laws of exponents to transform expressions and to decide if given forms were equivalent. Each Course 2 Posttest item was scored using a specific rubric that was based on the general framework given earlier. Figure 5 shows the mean Posttest results for a random sample of 584 CPMP students and for all 157 students in the traditional comparison classes who completed this test. The Cronbach Alpha reliability coefficient for the total test was 0.86. Since CPMP and comparison students had nearly identical median ATDQT pretest scores, a comparison of the posttest means is appropriate. (As was true in the Course 1 analysis, the comparison group had a slightly higher mean on the ATDQT pretest.) CPMP students' CPMP Posttest Part 1 mean scores in these schools were higher than comparison students on all three subtests. The effect sizes on the Coordinate Geometry, Algebra Concepts, and Procedural Algebra subtests were 0.62, 1.27, and 0.06, respectively.
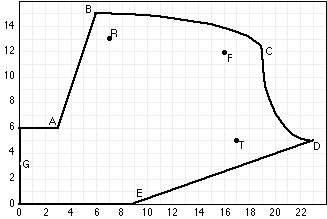
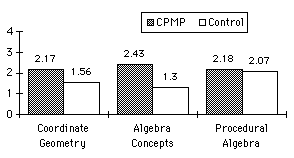 Figure 5. Course 2 CPMP Posttest Part 1 subtest means of CPMP and comparison groups The task given in Figure 6 is from the Coordinate Geometry subtest. Means and standard deviations of the CPMP and comparison groups are provided. Parts (a) - (d) required application and some interpretation of usual coordinate geometry methods-finding an equation of a line through two given points, coordinates of a point on a given line, midpoint of a given segment, and distance between two points. The intent in part (e) was for students to use the given grid and a valid strategy for estimating the number of square units inside the amusement park. The most common valid strategy involved subdividing the park into rectangular and right triangular sections, finding the area of each section, and summing the areas. Another productive approach was to start with the minimum rectangle that contains the entire park, which has area 33,000 m2 and then subtract the areas of regions in that rectangle that are not in the park. Of course, it was also necessary to estimate in some reasonable way the areas of regions that were bounded by the irregular edges of the park. Whatever estimation strategy was used, the estimate of the area of the park should have been more than 20,000 and less than 25,000 m2. As a result, students should have concluded that the planned park will not have sufficient area to handle the estimated crowds. A response with all the above elements received a score of 4. The mean of the CPMP students on part (e) was 2.0. A score of 2 was assigned if (1) the conclusion was correct and the estimate was between 20,000 and 25,000 but there was no explanation or (2) the estimate was between 20,000 and 25,000 yet the conclusion was incorrect with an (obviously faulty) explanation. On average, comparison students scored at the 1-level on this part. A score of 1 means that either (1) the estimate was outside the acceptable range and there was an explanation or (2) an incorrect conclusion with weak or irrelevant attempts at estimation and explanation. Assessment Setting A plan for a new Amusement Park is sketched on a grid below. One unit on the grid is equivalent to 10 meters. The main gate is located at point G. The entrances to some rides are marked: the Ferris Wheel F, the Roller Coaster R, and the Tilt-a-Whirl at T. Complete the following tasks about the plan.
|
||||||||||||||||||||||||||||||||||||||||||||||||||||||||||||||||||||||||||||||||||||||||||||||||||||||||||||||||||||||||||||||||||||||||||||||||||||||||||||||||||||||||||||||||||||||||||||||||||||||||||||||||||||||||||||||||||||||||||||||||||||||||||||||||||||||||||||||||||||||||||||||||||||||||||||||||||||||||||||||||||||||||||||||||||||||||||||||||||||||||||||||||||||||||||||||||||||||||||||||||||||||||||||||||||||||||||||||||||||||||||||||||||||||||||||||||||||||||