 |
|||
Conference MaterialAn emerging profile of the mathematical achievement of students in the Core-Plus mathematics project
In addition to geometry and algebra strands, CPMP's curriculum also includes statistics, probability, and discrete mathematics. CPMP students were assessed on these two strands on the CPMP Posttest Part 2 for each course. Since comparison students would have little opportunity to learn this content, they did not complete part 2 of these posttests. An example of a discrete mathematics assessment item from Course 2 Posttest Part 2 is given in Figure 7. CPMP students' achievement level in statistics and probability is discussed later. Assessment Setting For a time in the nineteenth century, a Pony Express mail system was used in some of the great plains states. Mail routes between towns were given a rating depending on distance, difficulty, and time. Five towns on the Pony Express system are St. Joseph (S), Omaha˙(O), Denver˙(D), Oklahoma City (K), and Dodge City (G). This diagram illustrates the mail routes between pairs of these towns and the rating of each.

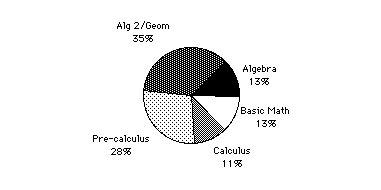
Figure 7. Discrete Mathematics task from the Course 2 Posttest Part 2 This task is based on content found in the Course 2 unit, "Network Optimization." Parts (a) and (b) involve calculating and comparing ratings for various routes. Part (c) requires a minimal spanning tree for this network. Means on the 0 - 4 rubric suggest that most CPMP students understood the tasks and completed them successfully. NAEP-based Test The National Assessment of Educational Progress (NAEP) is administered periodically as a means of monitoring U. S. students' achievement levels in various subject areas. In 1990 and 1992, a NAEP mathematics assessment was administered at several grade levels, including grade 12. As another measure of CPMP students' achievement, a 30-item test was constructed with balance among the five content (numbers & operations; measurement; geometry; data, statistics & probability; and algebra & functions) and three process categories (concepts, problem solving, and procedures). The NAEP subtest and item results are another component of the emerging profile of CPMP students' achievement. The NAEP-based test was administered in May 1997 to CPMP students at the end of Course 3. A total of 1,292 students in 23 CPMP field test schools completed this test. The students in these schools were generally representative of all CPMP students in the field test at the end of Course 3. For example, the students in these 22 schools who took both the Course 1 ATDQT pretest and the Course 3 ATDQT posttest had a mean of 270.35 and standard deviation of 35.81 on the Course 1 pretest, which is very close to the mean of 267.79 and standard deviation of 35.77 for all students in the field test schools. The items were part of the NAEP assessment of twelfth-grade students in October of either 1990 or 1992. According to Kenney & Silver (1997), the 1992 NAEP sample consisted of 8,499 students that were representative of all twelfth graders in the country. One important descriptor of 1992 twelfth-grade students, from which the NAEP sample was drawn, is the highest level of mathematics course taken in high school. This data, taken from school transcripts, is given in Figure 8.
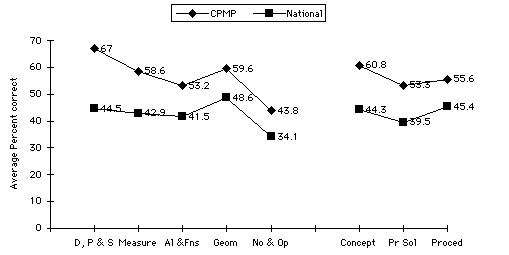
 Figure 8. Percent of 1992 students completing various high school courses (Rock & Pollack, 1995) On the 30-item NAEP-based CPMP test, the mean of the national sample was 12.8 (42.7%). The Course 3 students' mean was 16.9 (56.4%) with standard deviation of 5.36. This difference in overall means is large (about 0.77 standard deviations), but no assurance can be given of the comparability of the two groups' mathematical aptitudes and backgrounds. (The 30-item NAEP-based test had a KR-20 reliability of 0.82 when administered to the CPMP sample.) Rather than focus on comparing means of the NAEP sample with those of the Course 3 students, the item data from the NAEP sample is used as a benchmark of the difficulty of an item or of all items in a content or process category. This approach allows for meaningful between-item and between-category comparisons of Course 3 students' results. Given the large difference in overall group means, it is not surprising that the Course 3 students scored considerably higher than the NAEP sample in all content and process categories. However, the magnitude of the differences varied among categories, and it seems reasonable to assume that the larger the difference in means in a category, the better the relative performance of the CPMP students. Figure 9 illustrates the mean percent correct in each content and process category for the Course 3 students and for the NAEP sample. Content and process categories appear in descending order of the difference between the two mean percents.
 Content Subtest Process Subtest Figure 9. Percent correct on each NAEP subtest for CPMP and NAEP twelfth-grade sample Of the process categories, CPMP students' performance relative to the NAEP sample was best on conceptual items followed by problem solving and finally by items in the procedural category. This outcome is consistent with CPMP's emphasis on sense making, on applications and on problem solving with an accompanying de-emphasis on procedural skill practice. Although the following presentation of results is organized by content categories, NAEP's process categorization of each sample item is also provided. Content Categories Of the five content categories, the Course 3 students scored highest on data analysis, statistics and probability, a strand of the CPMP curriculum that is not emphasized in most of the more traditional mathematics curricula. Three of the four items in this content category were classified by NAEP as conceptual and one as problem solving. All four items are given in Figure 10.
Figure 10. Sample data analysis, statistics and probability items On the first item, CPMP students showed an understanding of statistical concepts like mean, median, range and standard deviation well beyond the level of the NAEP twelfth-grade sample. On the second item, 80% of CPMP students were able to solve a problem involving the idea of sampling. The third item simply requires reading a graph, which 93% of CPMP students were able to do. The fourth item requires an understanding of a scatterplot and the concept of median. CPMP students performed particularly well on the third and fourth items as they consistently do on tasks that assess interpretation of information presented graphically. Second to data analysis, statistics and probability, CPMP students performed especially well on measurement items. The eight items in the measurement category assessed students' understanding of and ability to apply various measurement topics including the volume of a right circular cylinder, volume of a rectangular prism, perimeter and area of a rectangle and square, and area and circumference of a circle. Six of these items are classified as problem solving and two as procedural. Differences in percent correct on the eight items for CPMP students compared to the NAEP twelfth-grade sample ranged from 6% to 27%, all higher for the CPMP students. Four measurement items are given in Figure 11, including the ones with the greatest and least performance difference and one that is classified by NAEP as procedural.
Figure 11. Sample measurement items On the six items that NAEP classified as algebra & functions, CPMP students averaged 11.7% higher than the twelfth-grade NAEP sample, third among the five content categories. Specific content in this category included evaluating an algebraic expression for a given value of x, finding the cosine of an angle, finding the length of an altitude of a right triangle using trigonometry, solving an exponential equation, and using a given "if-then" statement to determine which of several statements cannot be true. Three of these items were classified as conceptual, two as procedural and one as problem solving. Two of the procedural items, a conceptual item, and a problem solving item are given in Figure 12. Again, the item performance differences in favor of the CPMP students were less on the procedural items than on those classified as conceptual or problem-solving, as was the case for the entire test.
Figure 12. Sample algebra & functions items The NAEP twelfth-grade sample scored higher than the CPMP students on only two of the 30 items on the test. One of those items was in the algebra & functions category. In that item, students were to identify a given graph as x*y from among choices x * y, x < y and x > y. Just 35% of CPMP students and 36% of NAEP twelfth graders responded correctly. A partial explanation for the relatively poor performance of CPMP students on this item may be that the curriculum emphasizes a function approach. Thus, CPMP students usually worked with inequalities in which y was on the left and f(x) was on the right. On the seven geometry items, the CPMP students average percent correct was 11.0 percentage points higher than that of the NAEP twelfth graders. Three of the seven geometry items were classified as conceptual, two as procedural, and two as problem solving. Two conceptual, one procedural and one problem solving geometry item are given in Figure 13.
Figure 13. Sample geometry items Specific content of the seven geometry items included identifying properties of a rectangle, finding the slope of a line given the coordinates of two of its points, finding the distance between two points with given coordinates, finding the points of intersection of a line and a circle, finding the measure of the angle formed by the bisectors of two adjacent angles, finding the length of the side of a square from the radius of the inscribed circle, and applying the fact that a parallelogram is formed whenever the midpoints of a quadrilateral are joined in succession. The five items that were categorized as numbers & operations assessed percent, ratio and proportion, and operations with integers. For the most part, these topics are assumed and used in applications in both the CPMP and the traditional high school curricula for college-intending students but not taught as new content. One topic in this category that is taught in both curricula is exponential growth including compound interest. Of the five items in the numbers & operations category, two were classified as conceptual, two as procedural, and one as problem solving. One item of each process type is given in Figure 14. As these items exemplify, number & operations was the most difficult of the five content categories with CPMP students averaging 43.7% correct compared to just 34.1% for the NAEP twelfth graders.
Figure 14. Sample number & operations items The second of two items in which CPMP students had a lower percent correct than the NAEP twelfth-grade sample was a number & operations item. The stem of this item read "In a group of 1,200 adults, there are 300 vegetarians. What is the ratio of nonvegetarians to vegetarians in the group?" Only 25% of NAEP twelfth graders and 21% of Course 3 students chose the correct response, "3 to 1." More CPMP students were attracted to "4 to 1" (36.7%) and "1 to 4" (31.2%) than to the keyed answer. A partial explanation for the poor performance of students on this item may lie in its specialized wording, which is likely to be used when students are first learning the ratio concept (that is, in middle school) but is rarely encountered in more realistic or mathematically advanced settings. This item was also one of the four poorest discriminating items for CPMP students with a discrimination /index (biserial correlation of scores on the item with scores on all 30 items) of 0.27 compared to a mean item discrimination /index of 0.40 across all 30 items.
In this section, we summarize the findings to date with respect to mathematical achievement of CPMP students on various criterion measures. The first set of findings are based on ATDQT test forms as criterion measures.
|
||||||||||||||||||||||||||||||||||||||||||||||||||||||||||||||||||||||||||||||||||||||||||||||||||||||||||||||