page 9 of 13
Chapter Six
Current Status of Teachers' Beliefs and Practices
During the core evaluation process, considerable data were collected about mathematics and
science instruction in LSC districts. This chapter presents data on the current status of teacher
beliefs and practices, drawn from teacher questionnaires, teacher interviews, and classroom
observations.
Description of Targeted Teachers' Beliefs and Practices
The cross-site data analyzed for this report support many of the findings of the previous year. As
can be seen in Table 13, teachers generally report positive attitudes toward teaching mathematics
and science, and they feel supported by colleagues to try out new ideas. Although they
frequently share materials and ideas with their colleagues, there is little time set aside during the
school week to work with peers. These findings are consistent across subjects and grade levels.
Table 13
Teacher Opinions about Science/ Mathematics Teaching
| |
Percent of Teachers Agreeing |
|
All Teachers |
K- 8 Science |
K- 8 Mathematics |
7- 12 Mathematics |
| I enjoy teaching mathematics/science. |
88 |
86 |
92 |
96 |
| I feel supported by colleagues to try out new ideas in teaching mathematics/ science. |
81 |
80 |
81 |
85 |
| Teachers in this school regularly share ideas and materials related to mathematics/ science. |
63 |
62 |
63 |
68 |
| Teachers in this school have a shared vision of effective
mathematics/science instruction. |
57 |
55 |
59 |
61 |
| Teachers in this school are well- supplied with materials for
investigative mathematics/ science instruction. |
53 |
50 |
61 |
45 |
| I have time during the regular school week to work with my
peers on mathematics/ science curriculum and instruction. |
16 |
14 |
19 |
18 |
Familiarity with National Standards
Teachers were asked about their familiarity with current national standards for
mathematics/ science education. Figure 23 shows the percentage of teachers in each group
indicating that they are "well informed" about the National Science Education
Standards/ National Council of Teachers of Mathematics (NCTM) Standards. Note that
secondary mathematics teachers were most likely, and elementary science teachers least likely,
to report being familiar with national standards.
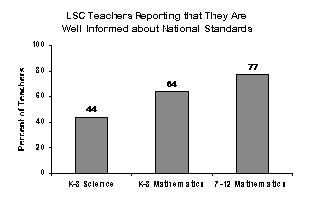
Figure 23
Beliefs about Effective Instruction
While they may not be familiar with the standards documents per se, most LSC elementary
teachers, nevertheless, report attitudes and beliefs that are in fairly close alignment with
standards- based instruction. (See Table 14.) For example, 90 percent of targeted elementary
science teachers and 80 percent of targeted elementary mathematics teachers believe it is very
important to have students participate in hands- on activities. Large numbers of these elementary
teachers also believe it is very important to provide concrete experience before introducing
abstract concepts and to engage students in inquiry- oriented activities. Secondary mathematics
teachers targeted by the LSC projects are less likely to consider these strategies to be of great
importance.
Table 14
Teachers Rating Each Factor Very Important for Effective Instruction
|
Percent of Teachers |
|
All Teachers |
K- 8 Science |
K- 8 Mathematics |
7- 12 Mathematics |
| Have students participate in appropriate hands-on activities |
84 |
90 |
80 |
52 |
| Provide concrete experience before abstract concepts |
79 |
80 |
82 |
57 |
| Develop student' conceptual understanding of mathematics/science |
77 |
74 |
84 |
77 |
| Take students' prior understanding into account when planning curriculum and instruction |
73 |
71 |
79 |
66 |
| Make connections between mathematics/science and other disciplines |
69 |
71 |
67 |
57 |
| Engage students in inquiry-oriented activities |
67 |
71 |
62 |
49 |
| Engage students in application of mathematics/science in a variety of contexts |
64 |
59 |
74 |
63 |
| Use informal questioning to assess student understanding |
56 |
57 |
57 |
44 |
| Practice computational skills and algorithms |
54 |
-- |
58 |
39 |
| Have students work in cooperative learning groups |
53 |
57 |
50 |
32 |
It is also interesting to note that support for ability grouping is stronger among mathematics
teachers than science teachers. (See Figure 24.)
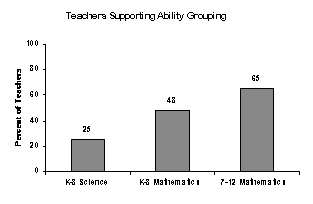
Figure 24
Feelings of Preparedness
Inclination toward standards- based instructional strategies is an important first step, but in order
to see meaningful change in classroom practice, teachers need also to be prepared to use these
strategies in their classrooms. Table 15 shows the percentage of teachers in each group reporting
that they feel at least fairly well prepared to implement each of a number of instructional
strategies in their classes.
Among the highlights:
- Elementary teachers are more likely than secondary teachers to feel prepared to use a
number of reform- oriented strategies, including hands- on activities and cooperative
learning;
- Higher proportions of elementary and secondary mathematics teachers than K- 8
science teachers feel prepared to develop students' conceptual understanding of their
subjects; and
- In each subject, relatively few teachers feel prepared to use either computers or
portfolios.
Table 15
Teachers Considering Themselves at Least Fairly
Well- Prepared to Implement Each Instructional Strategy
|
Percent of Teachers |
|
All Teachers |
K-8 Science |
K-8 Mathematics |
7- 12 Mathematics |
| Practice computational skills and algorithms |
90 |
-- |
89 |
93 |
| Have students work in cooperative learning groups |
83 |
83 |
84 |
74 |
| Have students participate in appropriate hands- on activities |
82 |
81 |
87 |
68 |
| Use informal questioning to assess student understanding |
81 |
81 |
82 |
76 |
| Take students' prior understanding into account when
planning curriculum and instruction |
79 |
75 |
87 |
78 |
| Make connections between mathematics/ science and other
disciplines |
76 |
75 |
81 |
69 |
| Develop students' conceptual understanding of
mathematics/science |
75 |
69 |
86 |
88 |
| Provide concrete experience before abstract concepts |
74 |
69 |
85 |
75 |
| Use calculators |
74 |
-- |
71 |
87 |
| Engage students in inquiry- oriented activities |
68 |
67 |
72 |
62 |
| Engage students in applications of mathematics/science in a
variety of contexts |
64 |
58 |
77 |
68 |
| Use performance- based assessment |
63 |
57 |
76 |
65 |
| Use portfolios |
51 |
50 |
56 |
40 |
| Use computers |
44 |
39 |
51 |
51 |
Differences are found in feelings of preparedness to teach content, as well. At the elementary
level, where teachers typically are responsible for teaching both mathematics and science,
teachers feel better prepared to teach mathematics content than science content. As can be seen
in Table 16, 92 percent of LSC elementary teachers report feeling at least fairly well prepared to
teach mathematics, compared to only 69 percent feeling that level of preparedness to teach
science.
Table 16
K- 8 Teachers Feeling Well- Prepared to Teach Each Subject
|
Percent of Teachers |
|
All Teachers |
Science |
Mathematics |
| Reading/Language Arts |
94 |
95 |
92 |
| Mathematics |
92 |
92 |
91 |
| Social Studies |
81 |
82 |
78 |
| Science |
69 |
72 |
64 |
Within these content areas, teachers feel better prepared to teach some topics than others. In
mathematics, the great majority of both K- 8 and 7- 12 teachers feel at least fairly well prepared
to teach computation, patterns and relationships, numeration and number theory, measurement,
and estimation. Somewhat fewer, but still more than three- fourths of the teachers in each group,
feel well prepared to teach geometry/ spatial sense, and data collection and analysis at their
assigned grade levels. In contrast, while 93 percent of grades 7- 12 mathematics teachers report
feeling at least fairly well prepared to teach pre- algebra and 86 percent to teach algebra,
relatively few K- 8 mathematics teachers feel prepared to do so. (See Table 17.)
Table 17
Mathematics Teachers Feeling Well- Prepared to Teach Each Topic
|
Percent of Teachers |
|
K-8 Mathematics |
7-12 Mathematics |
| Computation | 97 | 97 |
| Patterns and relationships | 91 | 90 |
| Numeration and number theory | 91 | 90 |
| Measurement | 90 | 95 |
| Estimation | 89 | 95 |
| Geometry and spatial sense | 84 | 85 |
| Data collection and analysis | 79 | 79 |
| Probability | 65 | 76 |
| Pre- Algebra | 60 | 93 |
| Technology in support of mathematics | 57 | 58 |
| Algebra | 47 | 86 |
| Functions and pre- calculus concepts | -- | 62 |
| Statistics | -- | 50 |
| Topics from discrete mathematics | -- | 35 |
| Calculus | -- | 29 |
| Mathematics structures | -- | 26 |
The situation is quite different in K- 8 science, where none of the listed topics comes close to the
"90 percent prepared" levels seen in mathematics. Teachers most often report feeling at least
fairly well prepared to teach topics from the biological sciences, such as the human body (69
percent) and ecology (63 percent). Far fewer teachers report feeling prepared to teach topics
from the earth and physical sciences. (See Table 18.)
Table 18
Science Teachers Feeling Well- Prepared to Teach Each Topic
| The human body | 69 |
| Ecology | 63 |
| Rocks and soils | 50 |
| Sound | 46 |
|
| Astronomy | 43 |
| Forces and motion | 41 |
| Processes of change over time | 39 |
| Mixtures and solutions | 39 |
|
| Machines | 39 |
| Electricity | 38 |
| Engineering and design principles | 22 |
Teachers' Perceptions of Their Instruction
Teacher questionnaire data, typically from 250 or so responding teachers per project, were
supplemented by data from interviews with about 10 teachers in each Cohort 1 and Cohort 2
project. As part of this interview, teachers described their attitudes and classroom practice
before the LSC. Evaluators reported a high degree of prior alignment in teacher beliefs about
mathematics/ science teaching, with roughly half of teachers describing prior attitudes quite
consistent with the LSC vision. About one- third of the interviewed teachers described
confidence in their ability to teach in the fashion advocated by the LSC, use of aligned
curriculum, and aligned instruction prior to the LSC. In contrast, only about 1 in 10 described
prior alignment of assessment practices. These results suggest that the LSC projects had a good
base upon which to build, with quite a few teachers favorably disposed toward reform.
It is interesting to note the difference in baseline belief alignment reported by teachers in their
questionnaires compared to the analyses given based on teacher interviews. The interviewers'
summary of alignment of beliefs prior to LSC involvement appears quite a bit lower than that
from the questionnaire. This may mean that teachers have a different interpretation of what
standards based teaching implies than that of the interviewers. They may be familiar with the
rhetoric of reform and so can identify the "correct" answer on the survey. But when asked to go
beyond this reform language and describe their beliefs in more reflective terms, discussion
reveals a lower level of alignment.
Frequency of Subject Area Instruction
Elementary teachers reported on the number of the last five school days they had taught each of
several subjects. Due to the emphasis on reading and mathematics in the elementary curriculum,
and perhaps also due in part to teachers' feelings of preparedness, science is taught less
frequently than either reading or mathematics. As can be seen in Figure 25, while mathematics
was taught on an average of 4.6 of the last five school days, science was taught on an average of 2.8 days.
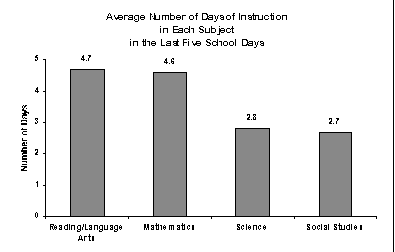
Figure 25
Observers' Descriptions of Classroom Practice
During the spring of 1997, trained observers in each project were to observe 10 randomly
selected classrooms. For Cohorts 1 and 2, the teachers to be observed had already participated in
at least 20 hours of professional development provided by the project. These are important data
because, unlike the questionnaire and interview data, they are not self- report.
A total of 519 classes were observed, including 292 science classrooms; 198 K- 8 mathematics
classrooms; and 29 7- 12 mathematics classrooms. These observations provided information on
student demographics, the physical environment, purposes and disciplinary content of the
lessons, class activities, and the quality of the lesson in relation to the LSC vision.
Observers noted that classes were relatively small, with most K- 8 classes having 25 students or
less. The secondary mathematics classes were even smaller, with 70 percent of the classes
observed having 20 or fewer students. In terms of race/ ethnicity, there is a bi- modal distribution,
with about a third of the classes having fewer than 25 percent non- white students, and another
third having more than 75 percent non- white students. (See Figure 26.)
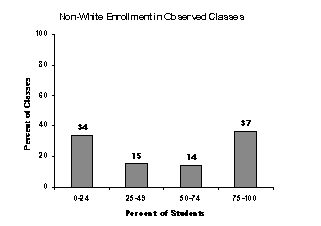
Figure 26
The classroom observation process is summarized in the following chart. Discussion with the
teacher occurred both before and following the lesson. Observers then scored their observations
on each of a series of individual indicators in the areas of design, implementation, content, and
culture/ equity. Each area was given a synthesis rating, and a final capsule rating was assigned to
the entire lesson.
|
The Classroom Observation Process
Interview Teacher
Observe Class
Conduct Post- Observation Interview
Rate Individual Indicators
Assign Synthesis Ratings
Assign Capsule Rating
|
Purposes of Mathematics and science Lessons
The observer talked with the teacher before and after observing each class to find out about both
the intended purpose of the lesson and whether these purposes shifted during the lesson for any
reason. As can be seen in Figure 27, roughly half of the K- 8 mathematics and science teachers,
but only 23 percent of the 7- 12 mathematics teachers, reported a major focus on developing
conceptual understanding.
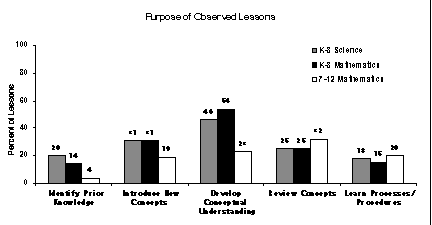
Figure 27
Use of Instructional Materials
Most of the LSC programs are designed around the implementation of a specific set of
mathematics or science instructional materials. Therefore, it is appropriate to consider how these
recommended instructional materials are being used in the classrooms of the participating
teachers.
In observations of classroom practice, the status of use of instructional materials ran the gamut
from "traditional" textbooks and worksheets to reform- oriented textbooks/ programs. Some
observed classes used materials developed by another school district or teacher- developed
materials, such as a mathematics lessons based on an inquiry workshop the teacher had
previously attended. However, the majority of the observations found classes using LSC-designated
including FOSS, Insights, AIMS, Life Lab, and Delta Science Modules in science;
and Mathlands, Teach- Stat, Connected Mathematics Project, Core Plus Mathematics Project, and
Investigations in Data, Number and Space in mathematics.
As might be expected, the quality of use of these materials varied greatly among observed
classes. Just because a teacher was using exemplary materials did not guarantee a wellimplemented
lesson. Problems noted by observers included classroom management issues, the
failure to make the connection from the hands- on activity to the mathematics or science
involved, and the noticeable lack of content knowledge on the part of the teacher that hindered
the discussion of the underlying mathematical or scientific concept. Many lessons, although
having students actively engaged with the materials, remained very teacher directed with little
student- to- student discussion or explanation of ideas.
Observers did note some classes where materials were being well- implemented. For example, in
a fifth grade "Mathlands" lesson on fractions, students worked in pairs, using the cards to create
fractional numbers with differing numerators and denominators. Students then decided where
each would go on a number line and drew a pictorial representation. The observer noted that the
students had a lot of input into the design of the investigation and were required to support their
decisions concerning where to place the fractional numbers. The lesson was characterized by
much on- task discussion among the students and many higher level questions from the teacher.
It was described by the observer as "dialogue rich," with a good balance of activity and
discussion.
Many evaluators commented in their annual reports (as noted elsewhere in this report) that they
noticed increased use over the life of the project of the LSC- designated materials, and that
teachers were attempting to implement these materials as designed. Many, however, were still at
the somewhat uncomfortable phase of "mechanical" implementation. With additional practice
and LSC support, the overall quality of the lessons observed should improve as teachers increase
their knowledge of the science or mathematics involved and become more facile at classroom
management.
Classroom Activities
Evaluators were given a checklist of possible class activities and asked to indicate the ones that
were included in the observed lesson. As can be seen in Table 19, elementary mathematics and
science lessons were more likely to include hands- on activities and class discussions than formal
presentation by the teachers. In contrast, 7- 12 mathematics teachers were about equally likely to
use formal presentations and investigative activities.
Table 19
Instructional Activities in Observed Classes
|
Percent of Lessons |
|
K- 8 Science |
K- 8 Mathematics |
7- 12 Mathematics |
Investigative activity
Hands-on
Problem-solving/proof and evidence |
81
78
17 |
88
54
62 |
68
14
59 |
| Class discussion | 61 | 57 | 26 |
| Formal presentation by teacher | 49 | 54 | 76 |
| Reading/writing/reflection | 48 | 37 | 49 |
Quality of the Lessons Observed
For Cohorts 1 and 2, evaluators observed lessons taught by teachers who had already participated
in LSC professional development. Many of these lessons were quite strong (ratings of 4 or 5) in
the extent to which:
- Active student participation was encouraged and valued (74 percent);
- The content was appropriate for the purposes of the lesson and developmental level of
the class (68 percent);
- The mathematics/ science content was significant and worthwhile (67 percent);
- Teacher- presented information was accurate (67 percent);
- The teacher was confident in his/ her ability to teach mathematics/ science (67 percent);
- The teacher was cognizant of prior knowledge of students (66 percent); and
- There was a climate of respect for students' ideas, questions, and contributions (65
percent).
In contrast, relatively few of these classes were highly rated for the extent to which:
- Adequate time and structure were provided for reflection (37 percent);
- Appropriate connections were made to other areas of mathematics/ science, to other
disciplines, and/ or to real- world contexts (37 percent);
- Intellectual rigor, constructive criticism, and the challenging of ideas were valued (36
percent);
- The lesson was modified as needed, based on teacher questioning or other student
assessments (33 percent);
- The teacher's questioning strategies were likely to enhance the development of student
conceptual understanding (31 percent); and
- The degree of closure or resolution of conceptual understanding was appropriate for
the developmental levels/ needs of the student and the purposes of the lesson (22
percent).
Summary
- Questionnaire data describe a targeted population of teachers who have positive attitudes
towards standards- based mathematics and science education, but in some cases do not feel
well prepared to implement these practices. Lack of preparedness is particularly evident in
K- 8 science, where fewer than half of the teachers feel well prepared to teach topics from the
earth and physical sciences.
- Classroom observations provide insight into areas of strength of LSC teachers and areas of
particular difficulty. Lessons taught by teachers who had participated in at least 20 hours of
LSC professional development tended to focus on significant content that was at an
appropriate level for their students; the teachers seemed to have a good understanding of their
students' prior knowledge and teacher- presented information was generally accurate.
Moreover, teachers were able to establish a classroom culture of active participation and
respect for students' ideas.
- Other areas are proving more problematic. Interestingly, these mirror some of the same areas
that have proven problematic in quite a few of the LSC professional development activities:
adequate time and structure for reflection; using questioning strategies that are likely to
enhance the development of conceptual understanding; making appropriate connections;
valuing intellectual rigor and the challenging of ideas; and providing an appropriate degree of
closure.
- It will be important for LSC project staff to focus on these problematic areas in planning
professional development programs, not only modeling effective practice in the context of
the designated instructional materials, but also taking the time to make these practices
explicit, as well as providing teachers with opportunities to develop skill in their use.

