 |


|
 |
 |
|
author:
|
Iris R. Weiss, Kathleen A. Rapp, Diana L. Montgomery
|
|
published in:
|
Horizon Research
|
|
published:
|
10/1997
|
|
posted to site:
|
02/04/1998
|
Introduction
In 1995, the National Science Foundation (NSF) began its Local Systemic Change through
Teacher Enhancement Program (LSC). The goal of the program is to improve the teaching of
science, mathematics, and technology by focusing on the professional development of teachers
within whole schools or school districts. Each targeted teacher is to participate in a minimum of
100 hours of professional development with an emphasis on preparing them to implement
exemplary science and mathematics instructional materials in their classrooms.
LSC projects are expected to align policy and practice within the targeted district(s) and to
include:
- A shared comprehensive vision of science, mathematics, and technology education;
- Active partnerships and commitments among stakeholders;
- A detailed self-study that provides a realistic assessment of the current system's strengths and needs;
- Strategic planning that incorporates mechanisms for engaging each teacher in intensive professional development activities over the course of the project; and
- A set of clearly defined, measurable outcomes for teaching, and an evaluation plan that provides on-going feedback for the project.
The LSC projects are distinguished from teacher enhancement projects of the past by their
systemic focus, including professional development for all teachers of science/mathematics at the
targeted grade levels, the implementation of exemplary instructional materials, and the alignment
of district policies and practices with the reform vision.
NSF contracted with Horizon Research, Inc. (HRI) to design and implement an evaluation for
collecting data that could be aggregated across projects. The core evaluation system designed by
HRI in conjunction with NSF and the project PIs and evaluators includes observations of
professional development activities and science and mathematics classrooms; teacher and principal
questionnaires; and teacher interviews. Project evaluators use these data, as well as any
additional, project-specific data they may have collected, to address the following core evaluation
questions:
- What is the overall quality of the LSC professional development activities?
- What is the extent of school and teacher involvement in LSC activities?
- What is the impact of the LSC professional development on teacher preparedness, attitudes, and beliefs about science and mathematics teaching and learning?
- What is the impact of the LSC professional development on classroom practices in science and mathematics?
- To what extent are the district and school contexts becoming more supportive of the LSC vision for exemplary science and mathematics education?
- What is the extent of institutionalization of high quality professional development systems in the LSC districts?
Project data sheets completed by the PIs provide some basic information about the 26 projects included in Cohorts 1 and 2.1
- Roughly half of the Cohort 1 and Cohort 2 projects are single-district projects; at the other end of the scale, 4 projects involve more than 10 districts, including 1 with 21 districts.
- The 8 Cohort 1 projects and 18 Cohort 2 projects plan to involve a total of 28,239 teachers in 1,312 schools in 121 districts across the United States.
- By the completion of these projects, an estimated 706,000 students will receive instruction from LSC-treated teachers each year.
- 20 projects target K-8 science; 2 projects target K-8 mathematics; and 4 projects target both K-8 science and mathematics.
This report presents highlights from the 1995-96 project year, including results from the 8 Cohort
1 projects that were in their second year of funding and the 18 Cohort 2 projects that were funded
in 1996.2
Description of LSC Professional Development
Core evaluation data to assess the quality of LSC professional development activities come from
observations of the professional development activities, and to a lesser extent, from teacher
questionnaires. Cohort 1 projects augmented these data with teacher interviews. Based on these
data, evaluators were asked to rate the quality of the project's professional development in eight
component areas and to provide an overall rating of the project's professional development
system.
|
Evaluators observed a total of 180
professional development activities,
an average of 7 per project. Using
a standard protocol developed by
HRI, they described the sessions
they observed; they also assessed
the appropriateness of the design of
each session for accomplishing the
stated purposes and the quality of
its implementation.
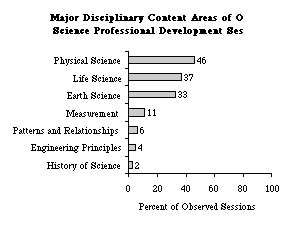
As can be seen in Figure 1, nearly
half of the observed science
sessions included physical science
content, 37 percent focused on life
science, and 33 percent had an
earth-science content focus.
|
Major Disciplinary Content Areas of Observed Science Professional Development Sessions

Figure 1
|
|
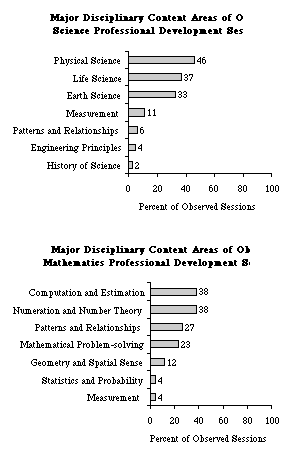
Major Disciplinary Content Areas of Observed Mathematics Professional Development Sessions

Figure 2
|
Among projects targeting
mathematics, the content areas of
focus were most often computation
and estimation, numeration and
number theory, patterns and
relationships, and mathematical
problem solving. (See Figure 2.)
While a few of the science sessions
included emphasis on one or more
mathematics topics (especially
measurement), none of the
mathematics sessions included
science content as a major focus.
|
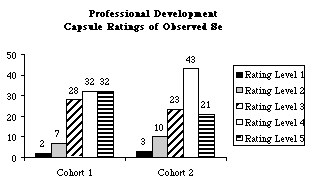
Figure 3 shows evaluators' overall "capsule ratings" of the observed sessions. Very few LSC
sessions were rated as ineffective professional development (Level 1), and fewer than 10 percent
were rated at Level 2, having quite limited likelihood of helping participants implement exemplary
science/mathematics instruction or be leaders in reform. More than 60 percent of the observed
professional development sessions received ratings of 4 or 5, with Cohort 1 sessions somewhat
more likely than Cohort 2 sessions to be considered "exemplary professional development."
Professional Development Capsule Ratings of Observed Sessions

Figure 3
The sample vignettes that follow illustrate two sessions with similar purposes, but judged to be
quite different in quality.
| Professional Development Session #1:
Third and fourth grade teachers were engaged in professional development around a kit-based
unit on water. One session focused on a lesson involving construction of a water thermometer.
There were multiple goals for participants: (a) to experience learning by inquiry, (b) to try out
the activity, and (c) to learn about instructional strategies. The facilitator began by questioning
the participants to learn what they already knew about thermometers, modeling the kinds of
questions and problems teachers might pose with their own students.
Pairs of participants constructed thermometers, and were engaged in making predictions,
investigating how those predictions could be tested, and actually carrying out mini-investigations.
The implementation was a real strength of the session. The facilitator knew just when to ask
thought-provoking questions to keep participants thinking and investigating further.
Participants were encouraged to share their ideas about thermometers, e.g., how they work, what
might go wrong, and how to deal with that. These discussions led to generating ideas about how
their "hypotheses" might be tested. At appropriate points throughout the session, the facilitator
wove in discussions about classroom application and classroom management issues. Overall, the
facilitator used a kit-based unit to skillfully model effective content, process, and inquiry.
This session received ratings of 5 in the areas of design and implementation; and ratings of 4 on
content, professional development culture, and likelihood of enhancing teachers' capacity to
implement exemplary science instruction. The session was placed at Level 5 for the overall
capsule rating, indicating this was an exemplary professional development session. |
| Professional Development Session #2:
A professional development session for first-grade teachers was designed to help the teachers
learn the content targeted by a kit-based unit on liquids, and to become familiar with the
activities included in the kit. Some participants were new to the system; others were veteran
teachers who wanted to learn more about the curriculum that they would be implementing in
their classes in the coming year. The session was led by two facilitators--a lead teacher in the
district and a scientist from a local university.
On the previous day, the lead teacher had taken participants through several activities included in
the kit. Most of the two-hour session on this day was focused on introducing the "big ideas" of
the unit to the whole group, with the scientist presenting content about atoms, measuring,
volume, density, and phase changes. While the presented information was accurate, there was
little integration of the content with the activities of the previous day. The presentation ended
with an activity in which the entire group role-played the movement of molecules at different
temperatures.
In the last half-hour of the session, the teachers met in small groups to discuss the content
covered in the morning presentation and to identify questions they may have about the content or
the activities included in the unit. The scientist and lead teacher initially circulated among the
groups; however, both of the facilitators spent the majority of the remaining time with one of the
four small groups to address questions about one of the activities from the previous day. The
session ended with an announcement of when the group would meet next for professional
development on a second unit to be implemented in all first-grade classes.
This session received ratings of 2 on a five-point scale on its design and implementation; and a
rating of 3 on content. Due to the lack of participant engagement and absence of collaborative or
participant-centered interactions, the session was rated 2 in professional development culture.
Overall, the session received a capsule rating of 2, indicating that there were elements of effective
professional development, but that there were major areas in need of improvement. |
Evaluators' overall ratings of the LSC professional development indicate that LSC projects are
generally providing high-quality staff development. Each of the component areas of professional
development--the design, the implementation, the disciplinary and pedagogical content, and the
culture of the sessions--received very high ratings, as well. Mean ratings for each of those areas,
as well as the likelihood that the project would enhance teachers' instructional capacity were
consistently between 3.5 and 4.0 on the five-point scale. Projects that focused on developing the
leadership capacity of teachers in the district were rated somewhat lower in that area, with a mean
rating of approximately 3.3.
Each project evaluator was also asked to rate the project's professional development system
holistically, considering all of the data available, and place their LSC project on a five-level
continuum. All evaluators judged the LSC projects to be at Level 3 or above on a five-level
continuum, indicating that the projects are either transitioning toward, or have already achieved, a
level of professional development reflective of current standards for best practice.
Table 1
Continuum Ratings for Quality of LSC Professional Development
|
|
Percent of Projects
|
|
|
All
|
Cohort 1
|
Cohort 2
|
| Level 1: Predominance of Ineffective Professional Development |
0 |
0 |
0 |
| Level 2: Exploring Quality Professional Development |
0 |
0 |
0 |
| Level 3: Transitioning to Quality Professional Development |
44 |
50 |
41 |
| Level 4: Emerging Infrastructure of Well-Designed Professional Development |
36 |
25 |
41 |
| Level 5: Predominance of Well-Designed Professional Development |
20 |
25 |
18 |
| Mean Continuum Rating Level |
3.8 |
3.8 |
3.8 |
Evaluators found that the professional development sessions generally incorporated state-of-the-art
strategies, including activities that were relevant to the teachers' work in classrooms, modeling
of effective pedagogical strategies, opportunities for teachers to reflect and talk with peers, strong
components of follow-up and support, and active involvement of teachers as key players in their
own professional development. The sessions were generally led by competent and skilled
facilitators and characterized by very positive cultures that encouraged the engagement of
teachers as professionals in learning communities.
Areas of strength for some projects were also described as areas in need of improvement for
others. For example, some evaluators commented on the need for participants to have more time
for reflection, increased attention to issues of classroom application. Others pointed out a need
for a better balance in attention to content and pedagogical strategies, or greater emphasis on the
content addressed by particular kits or modules. Finally, evaluators noted a need for more
consistency in the skills and expertise of facilitators.
Teacher Preparedness in Science and Mathematics Education
The core evaluation design calls for a random sample of teachers in each project to complete
questionnaires about their attitudes and instructional practices. In Cohort 2, these teachers are
providing baseline data about the status of science and mathematics education. In Cohort 1, the
sample includes teachers who have begun to participate in the LSC professional development, but
in most projects only a very small proportion of the teachers had received in-depth assistance at
the time of questionnaire administration.
Data collected from teachers in the LSC districts suggest that it will take a long and concerted
effort to prepare these teachers to teach science and mathematics in a standards-based fashion.
While the vast majority of teachers in LSC districts described attitudes in keeping with the
standards (e.g., noting that hands-on activities, inquiry-based instruction, providing concrete
experiences, and connections with other disciplines are very important for effective science and
mathematics instructions), relatively few teachers feel very well prepared to implement these
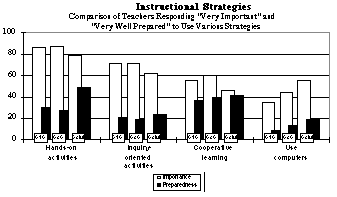
instructional strategies. For example, more than 80 percent of teachers in the LSC districts
indicated that it was very important to have students participate in hands-on science activities, but
only about 30 percent felt very well prepared in this area. (See Figure 4.)
Instructional Strategies
Comparison of Teachers Responding "Very Important" and "Very Well Prepared" to Use Various Strategies

Figure 4
Teachers are even more likely to recognize inadequacies in their content preparation. While all
but a handful of elementary science teachers feel at least somewhat prepared to teach such topics
as the human body and ecology, 20 percent or more indicated they were not adequately prepared
to teach sound, astronomy, forces and motion, mixtures and solutions, machines, processes of
change over time, and electricity, all areas that are integral to the elementary science curriculum.
Elementary mathematics teachers in LSC districts were likely to express confidence in their ability
to teach traditional mathematics topics such as computation, numeration and number theory,
measurement, and estimation. However, substantial proportions of teachers noted that they were
only "somewhat prepared" to teach some of the topics advocated for inclusion in standards-based
instruction in the elementary grades, including geometry and spatial sense, data analysis and
probability, and algebraic concepts.
Table 2
Level of Preparedness Reported by
Teachers in Various Science Content Areas
|
Percent of Teachers |
|
Cohort 1 |
Cohort 2 |
|
Not Adequately Prepared | Somewhat Prepared | Fairly Well Prepared | Very Well Prepared | Not Adequately Prepared | Somewhat Prepared | Fairly Well Prepared | Very Well Prepared |
| Ecology |
5 |
27 |
43 |
24 |
8 |
27 |
40 |
25 |
| The human body |
6 |
23 |
43 |
28 |
7 |
23 |
42 |
28 |
| Rocks and soils |
17 | 33 | 34 | 16 | 15 | 36 | 33 | 16 |
| Sound | 21 | 34 | 31 | 15 | 19 | 36 | 30 | 15
| | | | | | | | |
| Astronomy | 27 | 36 | 26 | 11 | 22 | 34 | 29 | 14 |
| Forces and motion | 27 | 38 | 27 | 8 | 24 | 37 | 27 | 11 |
| Mixtures and solutions | 28 | 36 | 25 | 12 | 25 | 35 | 28 | 12 |
| Machines | 29 | 38 | 25 | 8 | 27 | 34 | 27 | 12
| | | | | | | | |
| Processes of change over time | 31 | 34 | 24 | 10 | 28 | 36 | 26 | 10 |
| Electricity | 33 | 34 | 22 | 11 | 29 | 35 | 24 | 12 |
| Engineering and design principles | 49 | 33 | 13 | 4 | 51 | 29 | 15 | 5 |
Table 3
Level of Preparedness Reported by Cohort 2
Teachers in Various Mathematics Content Areas
| Percent of Teachers |
|
Not Adequately Prepared |
Somewhat Prepared |
Fairly Well Prepared |
Very Well Prepared |
| Computation |
0 |
2 |
26 |
72 |
| Patterns and relationships |
1 |
8 |
36 |
55 |
| Numeration and number theory |
1 |
9 |
35 |
55 |
| Estimation |
1 |
9 |
38 |
53 |
| Measurement |
1 |
9 |
38 |
53 |
| Geometry and spatial sense |
2 |
16 |
41 |
40 |
| Data analysis and probability |
7 |
27 |
40 |
27 |
| Technology in support of mathematics |
11 |
32 |
37 |
20 |
| Pre-algebra/algebra |
17 |
25 |
32 |
26 |
|
 |


