Core Evaluation Question II
What is the extent of school and teacher involvement in LSC activities?
Teacher Participation
Based on project reports, as of January 1996 a total of 3,980 teachers had participated in LSC professional development. These teachers teach science and/or mathematics to an estimated 99,500 students each year.
Table 6 shows the percent of teachers indicating on core evaluation questionnaires that they had participated in various kinds of professional development activities in the targeted subject area (not limited to LSC activities) in the previous 12 months. In each cohort, teachers were more likely to have participated in school- or district-level professional development activities than in individual activities such as coaching or formal action research projects.
Table 6
Teachers Reporting Participation in Various Types of
Professional Development Activities in the Past 12 Months
|
Percent of Teachers |
|
Cohort 1 Science |
Cohort 2 Science |
Cohort 2 Mathematics |
| District-level institutes/seminars | 75 | 52 | 72 |
| School-level workshops/study groups | 72 | 62 | 81 |
| Individual activities, e.g. coaching | 53 | 43 | 50 |
| One or more types of structured professional development activities | 87 | 76 | 89 |
The percentages of teachers participating in various numbers of hours of professional development are shown in Table 7. It is interesting to note that fairly large percentages of Cohort 2 teachers participated in professional development in the previous year, even though the LSC projects in those districts were just getting underway. Assuming that teachers participate in about the same number of hours of professional development each year, after 5 years roughly half of the Cohort 2 teachers targeted for mathematics and more than a quarter of those targeted for science would have received the designated 100 hours of professional development even without the LSC. The challenge of the LSC projects is to reach the teachers who are not participating in science/mathematics professional development on their own accord, to make sure all teachers in these districts experience high-quality professional development, and to do so in a coordinated fashion.
Table 7
Teacher Participation in Various Numbers of
Hours of Structured Professional Development
|
Percent of Teachers |
|
Cohort 1 Science |
Cohort 2 Science |
Cohort 2 Mathematics |
| 0 Hours | 13 | 24 | 11 |
| 1-6 Hours | 13 | 22 | 20 |
| 7-15 Hours | 14 | 16 | 17 |
| 16-35 Hours | 21 | 13 | 17 |
| 36-50 Hours | 16 | 9 | 13 |
| 51-75 Hours | 9 | 5 | 9 |
| 76-100 Hours | 6 | 4 | 6 |
| >100 Hours | 8 | 6 | 7 |
School Involvement in Reform
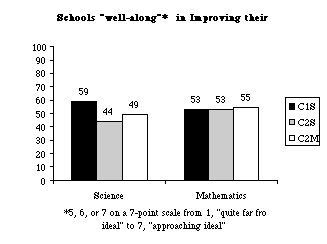
Principals of schools targeted for participation in the LSC were asked about the extent to which their schools were involved in reform in each of a number of subject areas. As can be seen in Figures 21 and 22, Cohort 1 schools stand out as being more likely than others to be heavily involved in science reforms and more likely to be 'well along' in improving their science programs. Data collection in future years will help determine whether Cohort 1 schools happen to be ones more actively involved in science reforms, independent of participation in the LSC, or if this is an impact of involvement in LSCs.
Schools Heavily Involved in Reform in Each Subject

Figure 21
Schools "well-along" in Improving their Program

Figure 22
| 
