 |
|||
PaperA Summary of Project Efforts to Examine the Impact of the LSC on Student Achievement
by Eric Banilower
Prepared for:
Prepared by: Horizon Research, Inc.
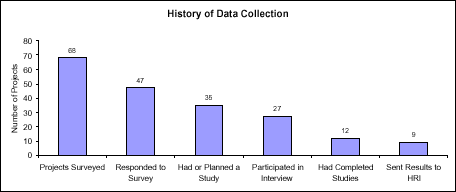
IntroductionIn February 2000, HRI surveyed the PIs of the LSC projects to ascertain whether they had undertaken any studies examining the impact of the LSC on student achievement. Forty- seven of the 68 projects responded. Of these, 12 indicated that they had no student achievement studies. HRI then contacted the remaining 35 projects for information about their study design, instrumentation, and results. Twenty- seven of the projects participated in the interviews between April and June 2000. The interviews revealed twelve projects had completed or nearly finished studies, four had begun studies, and six were in the planning stage of their studies. The other five projects interviewed did not have student achievement studies. A summary of the data collection process is shown in Figure 1.

Figure 1 This report analyzes individually the nine completed, or nearly completed, studies HRI was able to obtain, and then attempts to draw some conclusions across all of them. It is important to note that many of the studies reported only group means and did not statistically test group differences. Without information regarding the variance of group scores (i. e., standard errors or standard deviations), it was impossible for HRI to statistically test these differences or to estimate the magnitude of any differences for these projects. When possible, information on effect sizes1 and the results of statistical tests are included.2 One of the key issues to consider when analyzing these studies is their internal validity. In other words, how strong a case do the authors build that any impacts (i. e., increases in student achievement) are attributable to the treatment variable (i. e., participation in the LSC)? Two of the main factors contributing to a study's validity are how well the study's methodology controls for extraneous variables (e. g., initial ability level or school tracking policies) and the level of bias in sample selection (e. g., only teachers of advanced students are in the experimental group). A solid study should be designed to rule out plausible rival hypotheses that could explain any differences found equally well as the study's research hypothesis. To help the reader weigh the results, this report point outs any major threats to internal validity in each of the studies. Mathematics StudiesHRI was able to obtain reports or summaries of results from five mathematics projects, including one project which sent results from studies done independently by five participating schools. Overall, the quality of the studies is mixed; while most of the mathematics studies had notable threats to internal validity, a couple took steps to reduce these threats and strengthen their case that the LSC is attributable for gains in student achievement. One of the most common weaknesses of these studies was not controlling for initial differences between treatment and control groups. The exceptions were the Project 4 study and school #5 in Project 3. In general, the studies appear to show positive impacts of the LSC on students' mathematics achievement. However, results need to be interpreted with caution since in most cases it is difficult to make the case that the impact is due primarily to the LSC and not to other, unmeasured, interventions or policies. Project 1 (K- 12 Mathematics) At this time, the project has compared project wide results for 4th , 8th , and 10th graders from 1999 to 1998 using performance assessment items developed by the Balanced Assessment Project. Over 1000 students per grade level were tested each year. Sixteen items were repeated on both years' assessments: six 4th grade items, six 8th grade items, and four 10th grade items. The study found significant differences on nine of the sixteen items. As can be seen in Table 1, students in 1999 scored higher than students in 1998 on six of the items (three at 4th grade, two at 8th grade, and one at 10th grade) and scored lower on 3 items (all at the 8th grade level). The author points out that one should not read too much into these results as they are small changes, that different students were tested each year, and there was no control for initial differences in students' ability levels. Horizon Research, Inc. 3 October 2000
1998- 1999 Comparison of Student Performance Scores
Project 2 (K- 8 Mathematics) The project looked at the percent of students at or above the national norm on the ITBS, comparing 1999 data to each school's baseline year (the year before they became involved in the LSC). Results show increases for most of the schools involved with the LSC (see Table 2). However, there are no comparable data shown for non- LSC schools making it difficult to attribute these increases to the LSC. It is possible that ITBS scores were higher over this time period across the entire city due to factors unrelated to the LSC (e. g., familiarity with the assessment, or district retention policies).
Percent of Students at or above National Norm on the ITBS
|
|||||||||||||||||||||||||||||||||||||||||||||||||||||||||||||||||||||||||||||||||||||||||||||||||||||||||||||||||||||||||||||||||||||||||||||||||||||||||||||||||||||||||||||||||||||||||||||||||||||||||||||||||||||||||||||||||||||||||||||||||||||||||||||||||||||||||||||||||||||||||||||||||||