
 |
|||
PaperLSC Year Three Cross-Site Report
Chapter One |
|||||||||||||||||||||||||||||||||||||||
 |
 |
 |
 |
Figure 2
Characteristics of LSC Professional Development
Almost all of the LSC projects (96 percent) report that they are preparing teacher leaders to serve as mentors within the school. Substantially fewer include a peer mentoring/ teaching component (74 percent) or teacher study groups (65 percent) as part of their repertoire of professional development activities.
The LSC projects are using a diverse set of professional development providers. Nearly all of the projects report that they are using lead teachers in some capacity. Many also involve scientists, mathematicians, and engineers from higher education, business/ industry, and museums and other community organizations. (See Table 1.)
Table 1
Professional Development Providers in LSC Projects
| Percent of Projects | |
| Education Professionals Lead Teachers Higher Education District-Level Personnel Museums/Community Organizations |
98 96 74 52 33 |
| Scientists/ Mathematicians/ Engineers Higher Education Business/Industry Museums/Community Organizations |
80 72 50 30 |
While the focus of the LSC initiative is on providing high- quality professional development services to mathematics and science classroom teachers, many of the projects are also involving others in the school, district, and larger community. Figure 3 shows the percent of projects reporting that they have a formal component aimed at each of a number of groups within the LSC schools. Note that most LSC projects have a formal component aimed at principals, and almost half of the projects involve special education teachers, while other groups are less frequently targeted.
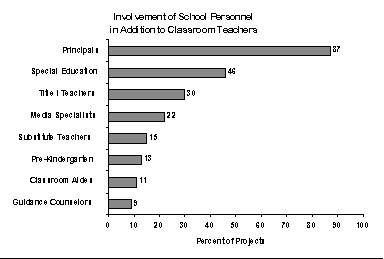
Figure 3
Figure 4 shows analogous data for groups outside the school. Slightly more than half of the projects report that they work with parents, roughly 40 percent include activities for central office staff and for business/ industry representatives, and 26 percent target higher education faculty. Only 15 percent of the projects target pre- service teachers, and only 9 percent have a component aimed at the general public.
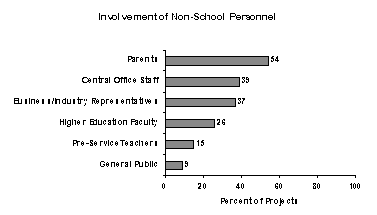
Figure 4
HRI has worked with the National Science Foundation and PIs and evaluators of the LSC projects on the design and implementation of a core evaluation system to allow aggregating information across projects. This section describes the data collection activities associated with the core evaluation. Results for the various core evaluation questions are presented in the following chapters, followed by a summary and recommendations chapter.
|
LSC Core Evaluation Questions 1. What is the overall quality of the LSC professional development activities? 2. What is the extent of school and teacher involvement in LSC activities? 3. What is the impact of the LSC professional development on teacher preparedness, attitudes, and beliefs about mathematics and science teaching and learning? 4. What is the impact of the LSC professional development on classroom practices in mathematics and science? 5. To what extent are school and district contexts becoming more supportive of the LSC vision for exemplary mathematics and science education? 6. What is the extent of institutionalization of high- quality professional development systems in the LSC districts? |
Data Collection
Data collection activities for the projects' 1996- 97 Core Evaluation Reports were conducted from September 1, 1996 through August 31, 1997. Cohort 3 projects were collecting baseline data for their first year of funding; this was the second year of data collection for Cohort 2 projects and the third year for Cohort 1 projects. Data collection activities included the following:
1. Observations of professional development activities
The core evaluation calls for projects to conduct 5- 8 observations of professional development sessions each year and record their observations on standardized protocols. Evaluators were to consult with PIs on what professional development experiences were planned throughout the data collection year, and select a sample that was representative of the diversity of the project's activities. Program- wide, a total of 276 observations of professional development sessions were conducted.
2. Classroom observations
HRI provided the lead evaluator of each project with a list of 10 randomly selected teachers for each targeted subject. These teachers, or their randomly selected back- ups, were to be observed in the spring of 1997. There was a total of 517 classrooms observed, including 299 classes taught by teachers who had participated in at least 20 hours of LSC professional development, and 218 classes as baseline for Cohort 3 projects. In all cases, the data were weighted to represent the total population of eligible teachers in the project.
3. Teacher questionnaires
Each project was asked to administer teacher questionnaires developed for the core evaluation to a sample of 300 teachers per targeted subject; the median response rate was 84 percent. A total of 10,054 teacher questionnaires were returned to HRI, including 6,126 from K- 8 science teachers; 2,347 from K- 8 mathematics teachers; and 1,581 from 7- 12 mathematics teachers. Weights were added to the data file to reflect the probability of each teacher's selection into the sample, adjusted for any non- response in that project.
4. Principal questionnaires
Projects were also asked to administer questionnaires to the entire population of principals of targeted schools. Return rates on the principal questionnaire were generally higher than for the teacher questionnaire; a total of 1,905 principal questionnaires were returned, with a median response rate of 92 percent.
5. Teacher interviews
Evaluators of each Cohort 1 and Cohort 2 project were asked to interview a sample of 10 teachers who had participated in at least 20 hours of professional development activities in that project. A total of 249 interviews were conducted among the 26 projects. About twothirds of the interviews were conducted by phone, and the remaining one- third in person. Evaluators summarized the interview data by completing an interview summary form with both ratings and qualitative descriptions of the information provided by each teacher. Interview data from each project were weighted to reflect the total number of teachers who had participated in LSC professional development in that project.
Data Analysis
Project evaluators were asked to report their findings using guidelines developed for the core evaluation system, including responding to the six core evaluation questions. Evaluators were also asked to provide overall ratings of the quality of professional development activities, the supportiveness of the context, and the sustainability of high- quality professional development systems. In some cases, evaluators used additional information in preparing their reports, including data resulting from expanded use of the core evaluation instruments as well as information from project- specific data collection activities.
To facilitate the reporting of large amounts of survey data, and because individual questionnaire items are potentially unreliable, HRI used factor analysis to identify survey questions that could be combined into "composites."2 Each composite represents an important construct related to one of the key evaluation questions. For example, there is a composite on the quality of LSC professional development, and several on teacher attitudes, preparedness, and classroom practice.
Once the questionnaire items associated with each composite were identified, composite scores were created. The composites are calculated as percentages of total points possible. An individual teacher's composite score is calculated by summing his/ her responses to the items associated with that composite and then dividing by the total points possible. For example, if a composite is based on six survey questions asked on a five- point scale of "strongly disagree" to "strongly agree," that composite has 30 total possible points. If a teacher's raw composite score on these six items adds to 24 points, the percentage score is 80 (computed as 24 * 30 * 100). A project's mean composite score is computed by averaging the scores of the individual teachers in that project.
In the results presented in this report, teachers, schools, and projects are sometimes categorized by cohort and sometimes by targeted subject (K- 8 science, K- 8 mathematics, or 7- 12 mathematics).3 Analyses of the impact of the LSC initiative on teachers and their teaching are typically reported by extent of teacher involvement in LSC professional development activities. Differences in proportions were tested using Chi- square procedures. Analysis of variance and t-tests were used to test the significance of differences in means of continuous variables, using the Bonferroni adjustment to compensate for the fact that multiple comparisons were performed. Differences noted in this report are statistically significant at the .05 level.
Footnotes
1 An abstract of each of these projects is included in the "Local Systemic Change Project Directory" available from the National Science Foundation. The Directory can also be accessed through the NSF home page at www.nsf.gov/cgi-bin/getpub?nsf97145.