|
A First Look at the Impact of LSC Professional Development
The core evaluation is designed to provide information about the impact of the LSCs on science and mathematics education in participating districts. In the early years, however, most projects will have provided professional development to only a relatively small proportion of the targeted teachers, especially if the initial stage focuses on the preparation of teacher leaders. In addition, a number of the core evaluation instruments were modified after the pilot year, making it difficult to identify trends.
This section presents the results of several preliminary analyses to look at the potential impact of the LSCs on teachers and teaching. They include results of interviews with participating teachers; comparisons of Year One and Year Two questionnaire results on identical items; and questionnaire results for teachers by level of participation in science and mathematics professional development.
Teacher Perceptions of the Impact of the LSC
Interviews with Cohort 1 science teachers indicate that the LSC professional development contributes to more positive feelings about teaching science and mathematics. While in some cases, teachers who were interviewed indicated that they had attitudes favorable toward reform even before they began LSC professional development, others with formerly negative attitudes about teaching science report that they are becoming aware and open to the reform ideas because of their participation in the LSC. As two Cohort 1 elementary teachers noted:
"I have the memory of that 'D' in science. I did not have a good experience. Girls weren't encouraged in science then. I feel after teaching for many years and being confident about my teaching I'm ready to let go and take some risks. I need opportunities for practice and feedback, though."
"I taught years ago; everything had changed when I came back to teaching. If I had my choice of teaching, science would not be at the top of my list. However, I have enjoyed [the LSC project]. I'd take science over social studies. It changed the way I think about doing science, what I see with the children."
Teachers were also asked to describe how the LSC professional development had affected their classroom teaching. Roughly one-third of the interviewed teachers reported substantial impacts on their classroom instruction. Comments about how instruction had changed point to less reliance on textbooks and more use of student-centered strategies, e.g., engaging students in more independent work, increased use of cooperative learning groups, and greater attention to students' dialogue. Some teachers who had not experienced significant changes in their instruction were ones whose instruction was already aligned with the LSC vision for effective teaching and learning. However, some teachers initially resistant to the types of instruction advocated by the LSC project, continued to voice resistance.
In terms of impact on curriculum, a number of teachers mentioned that they are doing more integration of science with other discipline areas as a result of their LSC professional development experiences. In some cases the change was attributed to a direct focus on integration in the professional development; in other cases, teachers simply found that the thematic nature of the curriculum materials facilitated integration with other areas. Other teachers who felt their curriculum had not been impacted to a great extent commented on the lack of time available to teach science.
Relatively few of the teachers reported extensive impacts on their assessments of students. Comments indicate that those teachers whose assessment practices were impacted to a great extent were now using different assessment strategies (e.g., portfolios, student journals, embedded assessment activities, student drawings) or they were assessing different aspects of student learning (e.g., the connections they were making and conclusions being drawn).
Changes in Cohort 1 Science Instruction: Year One to Year Two
Many of the items used in the 1995 teacher questionnaires were revised based on the results of that pilot year for the LSC core evaluation. In this section, we compare the Spring 1995 and Spring 1996 questionnaire results for a small set of items that retained both the same item wording and the same response scale. In interpreting these results, the reader is cautioned that the response rates in the 1995 pilot year were quite low, and therefore it is not clear how representative these results were of the total population in the baseline year. In addition, on the average, only about 20 percent of the 1996 respondents had participated in LSC professional development by the time they completed the questionnaires so the comparisons are between an untreated population and a partially treated population.
The results in Table 23 indicate that overall teacher enjoyment of science teaching and the extent of collegiality among science teachers at the school level remained essentially the same from 1995 to 1996.
Table 23
Cohort 1 Science Teachers' Opinions About Science Instruction
|
Percent of Teachers Agreeing* |
|
|
1995 |
1996 |
| Enjoy teaching science | 86 | 88 |
| Feel supported by colleagues to try out new ideas for teaching science | 82 | 81 |
| Teachers in their school regularly share ideas and materials related to science | 63 | 65 |
* Including teachers who indicated they agreed or strongly agreed with each statement.
In contrast, there was a significant increase in the percent of teachers indicating they felt prepared to manage a class of students using hands-on activities. There was no change in the percent of teachers feeling prepared to use performance assessments. (See Figure 52.)
Cohort 1 Teachers Feeling At Least Fairly Well Prepared
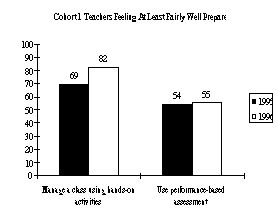
Figure 52
Cohort 1 Science Classes Engaged in Hands-on Activities Once a Week
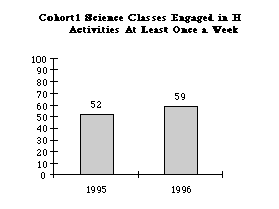
Figure 53
Finally, there was a small but statistically significant increase in the percent of Cohort 1 science classes engaged in hands-on activities at least once a week, increasing from 52 percent in 1995 to 59 percent in 1996. (See Figure 53.)
Comparison of Results by Level of Involvement in Professional Development
As another approach to exploring the possible impact of the LSC, HRI categorized Cohort 1 and Cohort 2 teachers based on their reported level of involvement in science and mathematics professional development to see if there were discernible patterns in their questionnaire responses.1
The results were quite consistent: in both science and mathematics, the larger the number of hours of professional development the teachers had received, the better prepared they felt to teach the subject and the more likely they were to report doing so in a standards-aligned fashion.
Figures 54 and 55 show the overall results for a number of the composites used in the LSC core evaluation. Note the relatively flat lines for attitudes towards teaching; even prior to the LSC projects, most teachers in the districts had quite positive attitudes toward science reform, so there was little room for improvement. In contrast, there were marked differences by level of involvement in professional development for other composites, including teacher knowledge of science/mathematics topics; use of student-centered strategies; and level of administrative support for reform.
1996 LSC Science Composites by Extent of Teacher Participation in Professional Development
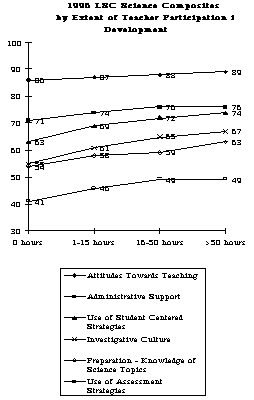
Figure 54
1996 LSC Mathematics Composites by Extent of Teacher Participation in Professional Development
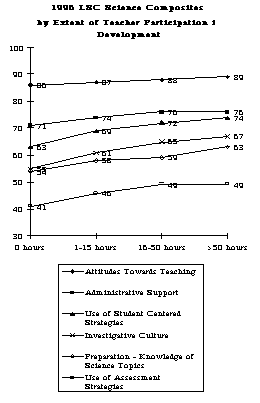
Figure 55
The trends can best be illustrated by looking at individual items. For example, only 29 percent of the "0 hours professional development" group of teachers indicated they felt very well prepared to teach geometry and spatial sense, compared to 49 percent of the teachers who had participated in more than 50 hours of professional development in mathematics education in the last year. Similarly, the percent of science teachers feeling very well prepared to teach electricity ranged from 7 percent for teachers with no professional development in science in the previous year to 17 percent of those who had more than 50 hours of professional development. (See Figures 56 and 57.)
Teachers Feeling Very Well Prepared to Teach Each Mathematics Topic
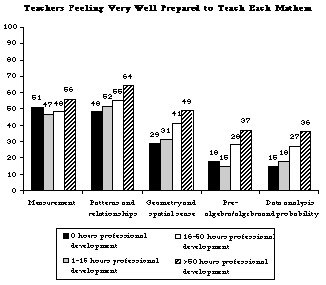
Figure 56
Teachers Feeling Very Well Prepared to Teach Each Science Topic
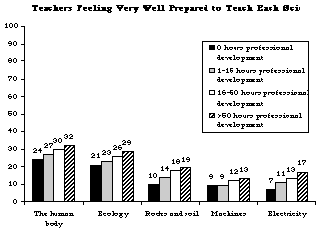
Figure 57
As can be seen in Figures 58 and 59, the pattern is the same for teacher preparedness to use particular pedagogical approaches. In science, teachers feeling very well prepared to engage students in inquiry-oriented activities ranged from 13 percent of those with no professional development in the past year, to 28 percent of those with more than 50 hours; the comparable range for mathematics was 16 to 32 percent.
Teachers Very Well Prepared For Each Activity - Science
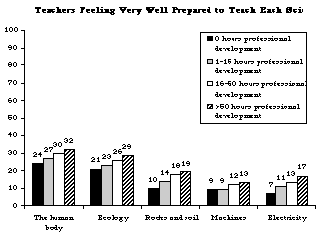
Figure 58
Teachers Very Well Prepared For Each Activity - Mathematics
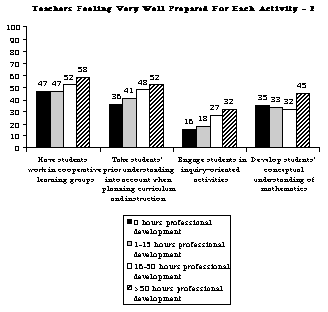
Figure 59
Similarly, teachers who had received the most professional development were most likely to feel prepared to recognize and respond to student diversity, to encourage students' interest in science and mathematics, to use strategies aimed at encouraging female and minority participation, and to involve parents in the education of their children. (See Figures 60 and 61.)
Teachers Feeling Very Well Prepared in Aspects of Equity and Diversity - Science
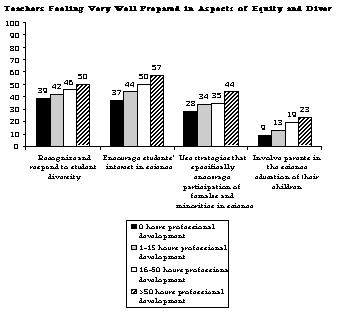
Figure 60
Teachers Feeling Very Well Prepared in Aspects of Equity and Diversity - Mathematics
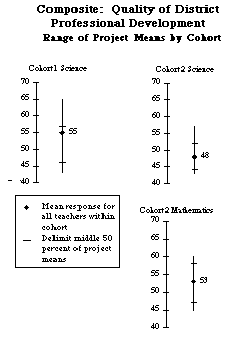
Figure 61
Finally, Figures 62 and 63 show the use of a number of instructional strategies in science and mathematics classes whose teachers have had varying amounts of professional development in the previous year. In each case, and many others not included here, teachers with substantial professional development were more likely than other teachers to report using reform-oriented, standards-aligned instructional practices.
Instructional Strategies in Each Science Class

Figure 62
Instructional Strategies in Each Mathematics Class
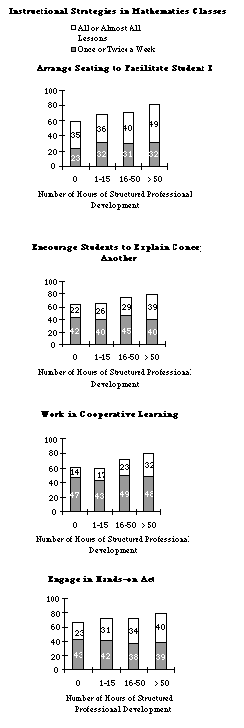
Figure 63
Summary
Preliminary analyses of trends from a variety of data sources indicate positive, and in some cases, substantial, impacts of professional development on teachers' feelings of confidence and preparedness to teach science and mathematics, and on instructional practices in their classrooms. Particularly striking are the trends associated with the number of hours teachers have participated in structured professional development activities. Consistently, in both science and mathematics, as the number of hours of professional development increases, larger percentages of teachers report feeling well-prepared to teach science and mathematics, and larger percentages report use of reform-oriented strategies in their instruction.
Footnotes
1 Teachers designated as "lead teachers" were most likely to (a) have received extensive professional development and (b) have already been exemplary in their preparation and instructional practice. To avoid inappropriate interpretations, teachers who indicated they were serving as lead teachers for the LSC were excluded from these analyses. Note that the question about number of hours spent on structured professional development,(including institutes, workshops, study groups, and formal action research projects) did not specify LSC professional development since many of the Cohort 2 projects had not yet begun providing these services to teachers. These preliminary analyses use science/mathematics professional development in general as a proxy for the LSC professional development.
| 
