
 |
|||
PaperLSC Year Three Cross-Site Report
Chapter Three |
||||||||||||||||||||||||||||||||||||||||||||||||||||||||||||||||||||||||||||||||||||||||||||||||||||||||||||||||||||||||||||||||||||||||||
| Percent of Sessions | ||||
| All Sessions |
K- 8 Science |
K- 8 Mathe- matics |
7- 12 Mathe- matics |
|
| Working on classroom pedagogy issues*
Learning about specific instructional materials Learning pedagogical/ classroom management strategies Creating a vision of learning through investigation Designing/ scoring student assessments Considering issues of access, equity, and diversity |
75 38 36 35 9 6 |
77 37 37 39 11 7 |
69 31 39 27 6 4 |
75 51 30 30 4 4 |
| Increasing teacher mathematics/ science content knowledge | 40 | 37 | 39 | 49 |
| Promoting reflective practice | 17 | 18 | 10 | 19 |
| Developing teacher leaders | 15 | 14 | 15 | 15 |
| Building professional networks among educators | 14 | 14 | 12 | 15 |
| Orientation to the project Developing capacity of participants to use technology |
14 5 |
13 5 |
23 2 |
11 9 |
* Percents add to more than total for category because sessions could include more than one purpose.
Content Focus of Professional Development Sessions
When sessions focused on one or more disciplinary content areas, evaluators were asked to categorize that content. In K- 8 science projects, evaluators reported that nearly half of the sessions that had a disciplinary content focus dealt with physical science concepts (46 percent), nearly that many with life science content (41 percent), and somewhat fewer with concepts from the earth and environmental sciences (32 percent). Evaluators also reported that a number of the observed K- 8 science sessions dealt with data collection and analysis, measurement, engineering and design principles, estimation, and patterns and relationships. (See Figure 8.) None of the observed K- 8 science sessions emphasized the history of science.
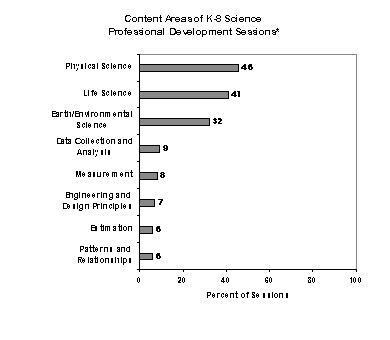
Figure 8
Percentages add to more than 100% because sessions could
include more than one content area.
* Only sessions that focused on disciplinary content were included in these analyses.
In projects targeting K- 8 mathematics, the most heavily emphasized topics were patterns and relationships (32 percent of the sessions that dealt with disciplinary content), numeration and number theory (29 percent), and data collection and analysis (23 percent). Computation, geometry and spatial sense, probability, measurement, and statistics were each the focus of 10- 16 percent of K- 8 mathematics content-focused professional development sessions; sessions for K- 8 mathematics teachers rarely focused on pre- algebra or algebra. (See Figure 9.)
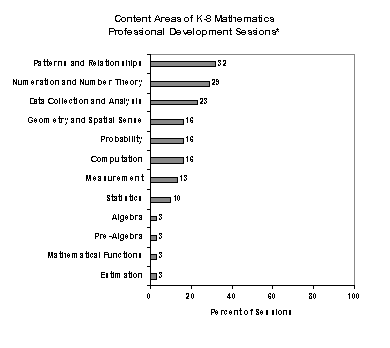
Figure 9
Percentages add to more than 100% because sessions could
include more than one content area.
* Only sessions that focused on disciplinary content were included in these analyses.
As can be seen in Figure 10, the most commonly emphasized topics in sessions for 7- 12 mathematics teachers were patterns and relationships, algebra, and geometry/ spatial sense, each the focus of about 30 percent of the sessions that dealt with disciplinary content. Roughly 20 percent of the content- focused sessions addressed data collection/ analysis and probability, while about 10 percent focused on estimation, measurement, and statistics.
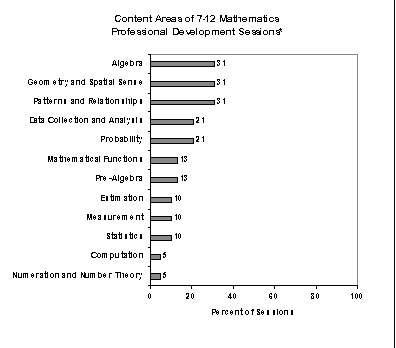
Figure 10
Percentages add to more than 100% because sessions could
include more than one content area.
* Only sessions that focused on disciplinary content were included in these analyses.
Session Activities
Most of the observed LSC professional development sessions included several different instructional strategies. As can be seen in Table 6, most sessions included discussions or seminars (83 percent), typically either in whole groups led by professional development providers or in small groups or pairs of participants. Roughly two- thirds of sessions included formal presentations, usually by project staff as opposed to participants; and a similar number included investigative/ problem solving activities. Fewer of the observed sessions involved participants in reading (21 percent) or writing (25 percent) about disciplinary content, pedagogy or reform issues.
Table 6
Major Activities of LSC Professional Development Sessions
| Percent of Sessions | ||||
| All Sessions | K- 8 Science | K- 8 Mathematics | 7- 12 Mathematics | |
Engaged in discussions/ seminars Whole group led by facilitator Whole group led by participants Small groups/ pairs |
83 64 9 49 |
83 66 9 45 |
77 57 8 55 |
92 65 13 57 |
| Engaged in problem- solving/ investigation | 68 | 70 | 58 | 73 |
Listened to a formal presentation By presenter/facilitator By participants |
68 65 11 |
69 67 10 |
77 71 14 |
54 50 10 |
| Wrote about disciplinary content, pedagogy, or reform issues | 25 | 23 | 27 | 29 |
| Read about disciplinary content, pedagogy, or reform issues | 21 | 20 | 31 | 15 |
In order to assess the quality of professional development sessions, evaluators were asked to rate a number of components for each session they observed, including:
The design of the session;
For each component area, observers first rated a series of individual indicators of best practice in professional development and/ or standards- based mathematics/ science instruction. These indicators were rated on a scale ranging from 1, "not at all" to 5, "to a great extent" to document the extent to which that feature characterized the observed professional development session.
Considering those "on- ramp" indicators, observers then assessed the overall quality of each component area. The lowest rating for component areas (Level l) indicated that the session was not at all reflective of best practice. The highest rating (Level 5) indicated that component of the session was extremely reflective of best practices for standards-based mathematics and science education.1 Evaluators' ratings of the component areas are presented in the following sections.
Design of Professional Development Sessions
As noted above, observers assessed the design of professional development sessions by rating a series of individual indicators based on current understandings of best practice. Several of these indicators received high ratings (4 or 5 on a five- point scale) in a large majority of the observed sessions. Those indicators that were most often highly rated included:
Somewhat fewer sessions were rated highly on:
Observers found that the majority of professional development sessions were highly reflective of best practice. As can be seen in Figure 11, 76 percent of the professional development sessions received overall design ratings of 4 or 5.
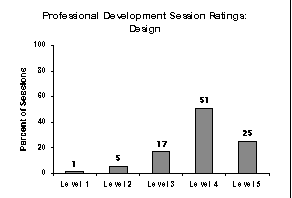
Figure 11
Implementation of Professional Development Sessions
Observers also assessed the implementation of professional development sessions. Indicators most frequently rated 4 and 5 were:
Fewer LSC professional development sessions were rated highly on other indicators, including:
As can be seen in Figure 12, 71 percent of the sessions received overall ratings of 4 or 5 on the quality of implementation.
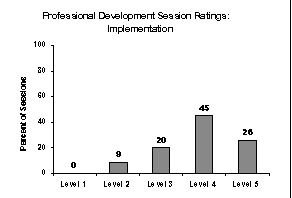
Figure 12
Disciplinary and Pedagogical Content
Evaluators were asked to rate either the quality of the disciplinary content of the observed session, its pedagogical content, or both, depending on the focus of the session. Disciplinary content was rated in 176 of the 276 sessions, with 73 percent of the sessions receiving overall ratings of 4 or 5 in this area. (See Figure 13.) Disciplinary content sessions were most likely to receive high ratings for:
Far fewer sessions received high ratings on:
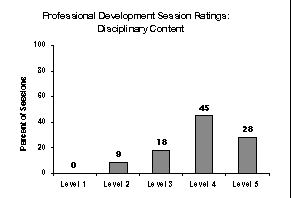
Figure 13
Observers rated 198 of the 276 observed professional development sessions on the quality of their pedagogical content. As can be seen in Figure 14, 71 percent of professional development sessions received ratings of 4 or 5 for overall pedagogical content.
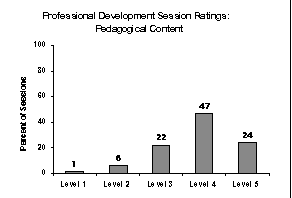
Figure 14
As was the case for disciplinary content, sessions tended to be highly rated for:
However, where 80 percent of the sessions that focused on disciplinary content received high ratings for content that was "sound and appropriately explored," only 66 percent of the sessions rated for pedagogical content received high ratings.
The two areas were more similar in terms of ratings of closure, with 57 percent of sessions focusing on pedagogical content (compared to 52 percent of those focusing on disciplinary content) receiving high ratings in this area.
Professional Development Culture
The literature on effective staff development emphasizes the importance of establishing a professional development culture where teachers can explore content and pedagogy in a collegial, risk- free environment. Seventy- eight percent of the sessions received synthesis ratings of 4 or 5 in this area. (See Figure 15.) Indicators that were most likely to receive high ratings included:
Two areas that were somewhat less likely to receive high ratings were:
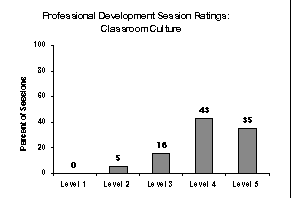
Figure 15
Observers were asked to consider all information available to them-- their own ratings of session components, related interviews, and their knowledge of the projects' professional development program-- as they assessed the overall quality of each observed session. Observers first considered the likely impact of the session on participants' capacity for exemplary mathematics/ science instruction and the likely impact on leadership capacity when leadership development was a focus of the session instruction.2 Finally, "capsule ratings" were assigned to characterize the overall quality of the professional development session. Ratings on a five- level scale ranged from "ineffective professional development" (Level 1) to "exemplary professional development" (Level 5).
Results of observers' ratings of impact and overall quality, as well as features that distinguished highly effective sessions from less effective sessions, are described in the sections below.
Sessions' Impact on Participants' Capacity for Exemplary Mathematics/ science Instruction
Observers rated the likely impact of each session on teachers' capacity for exemplary mathematics/ science instruction. According to these observers, LSC professional development sessions were most likely to have a positive effect on participants' ability to:
Fewer sessions were judged likely to have a positive effect on participants':
Capsule Ratings of Observed Professional Development Sessions
As would be expected, given the high ratings assigned by evaluators for the various components, overall ratings for individual professional development sessions were quite favorable. Only 1 percent of observed LSC sessions were rated as ineffective professional development (Level 1), and 7 percent were rated at Level 2, having quite limited likelihood of helping participants implement exemplary mathematics/ science instruction or be leaders in reform. Overall, 71 percent of the observed professional development sessions received ratings of 4 or 5, indicating that those sessions were skillfully facilitated, engaging participants in purposeful work that would likely lead to enhanced capacity to implement exemplary instruction. (See Figure 16.)
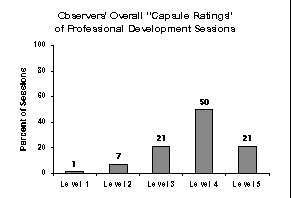
Figure 16
Comparison of Highly Effective and Less Effective Professional Development Sessions
To help identify the features that seem most critical in determining the quality of professional development sessions, HRI compared the most highly rated professional development sessions to those with lower ratings. In each of the component areas-- the design of the session, its implementation, the disciplinary and pedagogical content, and the culture of the session-- there were specific indicators that distinguished sessions judged to be highly effective from those that were considered less effective.
Table 7 shows the indicators in each of the component areas with the largest differences between highly effective (capsule ratings 4 and 5) and less effective (capsule ratings 1- 3) professional development sessions. For example, while the majority of mathematics and science professional development sessions (80 percent) included in their design, strategies that were appropriate for the purposes of the session, this feature characterized 97 percent of the sessions judged to be highly effective, but only 38 percent of the less- effective sessions. Similarly, over half of the observed professional development sessions (58 percent) included effective questioning strategies; however, this feature was highly rated in 79 percent of the effective sessions, as compared to only 8 percent of the less- effective sessions, a difference of 71 percent.
Other indicators showed smaller differences when comparing highly effective sessions to those rated less effective. These were typically areas of relative strength for the sessions with low capsule ratings. For example, 60 percent or more of the professional development sessions rated ineffective overall, nevertheless received high ratings for the appropriateness of the disciplinary content, having a climate of respect, valuing active participation of all, and having collaborative working relationships among participants. The differences in percentages of sessions receiving high ratings on those indicators were in the 26- 37 percent range, compared to the 55- 71 percent range for the indicators in Table 7.
Table 7 Indicators that Distinguished Between Highly Effective and Less Effective Professional Development Sessions
| Percent of Sessions | ||||
| All Sessions |
Highly Effective |
Less Effective |
Difference | |
Design Strategies appropriate for purposes of session |
80 72 59 |
97 88 74 |
38 32 19 |
59 56 55 |
Implementation Effectively incorporated appropriate instructional strategies |
76 58 |
95 79 |
29 8 |
66 71 |
Disciplinary Content Appropriate depth and breadth |
68 52 |
85 67 |
19 10 |
66 57 |
Pedagogical Content Appropriate depth and breadth |
67 66 57 |
86 83 74 |
20 23 13 |
66 60 61 |
Professional Development Culture Participants intellectually engaged with important ideas |
80 70 64 |
96 85 80 |
37 27 22 |
59 58 58 |
1 Copies of the Professional Development Observation Protocol may be found on the LSC Documents Page of the HRI web site: http://www.horizon-research.com/LSC.