 |
|||
PaperLSC Year Three Cross-Site Report
Chapter Four |
||||||||||||||||||||||||||||||||||||||||||||||||||||||||||||||||||||||||||||||||||||||||||||||||||||||||||||||||||||||||||||||||||||||||||||||||||
| Percent of Teachers | |||
| High | Medium | Low | |
| Adequate opportunities are available to me for mathematics/science-related professional development. | 54 | 31 | 15 |
| I receive support as I try to implement what I've learned. | 46 | 31 | 23 |
| I am encouraged to develop an individual professional development plan to address my needs and interests related to mathematics/ science education. | 35 | 29 | 36 |
| I am involved in planning my mathematics/ science- related professional development. | 33 | 26 | 41 |
| I am given time to work with other teachers as part of my professional development. | 26 | 27 | 47 |
| I am given time to reflect on what I've learned and how to apply it to the classroom. | 25 | 30 | 45 |
* Only teachers who had participated in LSC professional development were included in these analyses.
It is interesting to note that the more time teachers had spent in LSC professional development, the more highly they rated it. Table 9 shows the percent of teachers giving high marks to each feature of the LSC, broken down by extent of their participation in the LSC.
Table 9
Teacher Ratings of Characteristics of
LSC Professional Development Programs by Hours of Participation
| Percent of Teachers | ||||
| All Teachers | Hours of Participation | |||
| 1-19 | 20-39 | 40 or More | ||
| Adequate opportunities are available to me for mathematics/science-related professional development. | 54 | 39 | 62 | 70 |
| I receive support as I try to implement what I've learned. | 46 | 37 | 49 | 58 |
| I am encouraged to develop an individual professional development plan to address my needs and interests related to mathematics/ science education. | 35 | 27 | 36 | 46 |
| I am involved in planning my mathematics/ science- related professional development. | 33 | 23 | 33 | 49 |
| I am given time to work with other teachers as part of my professional development. | 26 | 19 | 28 | 36 |
| I am given time to reflect on what I've learned and how to apply it to the classroom. | 25 | 19 | 26 | 34 |
* Only teachers who had participated in LSC professional development were included in these analyses.
Note, for example, that only about 1 in 4 teachers with less than 20 hours participation, but nearly half of the 40-or-more-hours group, indicated that they were involved in planning their LSC professional development. Similarly, the percent of teachers indicating that they had adequate opportunities available for professional development ranged from about 4 in 10 of the low participation group to 7 in 10 of the high participation group.
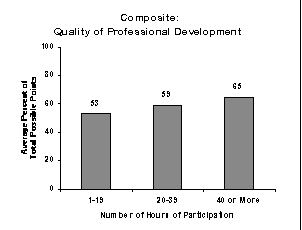
The six questionnaire items rating aspects of the LSC professional development were combined into a single composite called "Quality of Professional Development." 1 As can be seen in Figure
17, teachers who had been involved in at least 40 hours of LSC professional development had an average rating of 65 percent of total points possible, compared to 53 percent for those with fewer than 20 hours participation.
Figure 17
Comparison of LSC and Non- LSC Professional Development
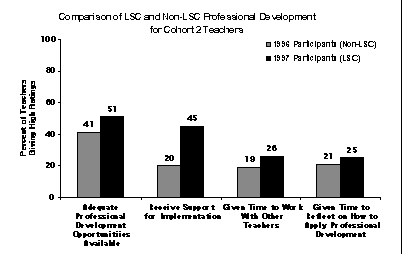
It is also interesting to compare teachers' ratings of LSC professional development to their ratings of prior non- LSC professional development experiences. The 1996 Teacher Questionnaire asked teachers to rate the quality of mathematics/ science related professional development in their district. Comparisons between LSC and non- LSC professional development were possible only for Cohort 2, since the question about general district- provided mathematics/ science professional development was asked in 1996, which was the baseline year for those projects.
The comparison of 1996 to 1997 ratings indicates that the extent to which teachers receive support as they try to implement what they have learned appears to be a major difference between the LSC and prior mathematics/ science professional development. As can be seen in Figure 18, 45 percent of the Cohort 2 teachers gave the LSC implementation support ratings of 4 or 5 on a five- point scale, compared to 20 percent for non- LSC professional development. In contrast, LSC professional development was rated much lower, and at about the same level as non- LSC professional development, in the extent to which teachers are given time to work with other teachers and think about how to apply what they have learned to the classroom. Across all projects, what clearly stood out as a strength of the LSC professional development for teachers was the support they felt as they implemented LSC reforms, while time to work with other teachers and time to consider classroom applications continued to be somewhat lacking.

Figure 18
Teachers' Ratings of Overall Quality of LSC Professional Development
Teachers were also asked to rate the overall quality of the LSC professional development. Across all subjects, 40 percent of the participants rated the LSC professional development very good or excellent, 54 percent fair or good, and 6 percent poor or very poor. (See Table 10.)
Table 10
Teacher Ratings of LSC Professional Development Programs Overall
| Percent of Teachers | ||||||
| Poor | Very Poor | Fair | Good | Very Good | Excellent | |
| K-8 Science | 1 | 4 | 18 | 33 | 30 | 15 |
| K-8 Mathematics | 2 | 8 | 28 | 33 | 23 | 7 |
| 7-12 Mathematics | 1 | 4 | 21 | 32 | 33 | 9 |
| All Teachers | 1 | 5 | 21 | 33 | 28 | 12 |
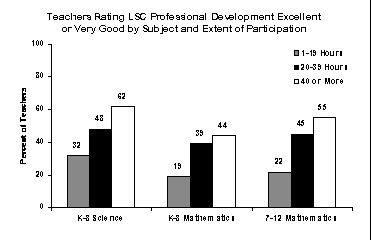
Ratings tended to be higher for both K- 8 science and 7- 12 mathematics than for K- 8 mathematics. For example, as can be seen in Figure 19, only 44 percent of K- 8 mathematics teachers who had participated in at least 40 hours of LSC professional development rated it very good or excellent, compared to 55 percent and 62 percent, respectively, of those who participated extensively in 7- 12 mathematics and K- 8 science professional development.

Figure 19
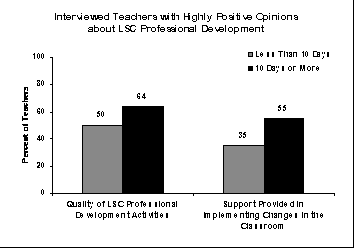
As noted earlier, K- 8 mathematics and science teachers in Cohort 1 and Cohort 2 who had participated in at least 20 hours of LSC professional development were also asked their opinions in interviews with project evaluators. Evaluators' summaries of the interview results are shown in Figure 20. While the categories of involvement in the LSC are defined somewhat differently than in the teacher questionnaire, the pattern is essentially the same, with teachers who had participated more extensively giving higher ratings to both the quality of the LSC professional development activities and the support provided in implementing changes in the classroom.

Figure 20
When teachers described their impressions of the LSC professional development, they identified a number of positive features of design and implementation such as:
In addition, teachers often described workshops as "well- planned" and "organized." This teacher's comment was typical:
FootnoteThe workshops are managed well, the presenters clear and well- prepared. What we did was sufficient to show us what we had to do in the classroom. I enjoy the handson activities, the cooperative grouping; I get to experience the lessons for myself first hand. Instead of using a textbook and seeing things through someone else's eyes, I see it through my own; I touch, feel, and observe it on my own. It's valuable because I can go through the experience first and can share what I've learned with the kids: I walk in their shoes.
1See pages 7 and 8 for a description of how composites were calculated.